Mid-year update: Lake Wylie real estate

Half of the year is now behind us, and the Lake Wylie real estate market is chugging right along, with strong numbers for the first half. Approximately $92 million in dockable, waterfront real estate (including homes and lots) have sold this year to date, according to the MLS. Dollar wise, that’s a level that surpasses even the record-breaking sales year of 2022.

Higher inventory levels for waterfront homes — and buyers willing to pay top-dollar for waterfront property — have propelled this year’s market to sales well above last year’s first half:
In the chart above, the blue bars represent the number of dockable waterfront homes sold on Lake Wylie through the end of June each year. The red bars represent the number of lots.
This years sales thus far total 56 homes and 21 lots, significant increases over last year. While the number of homes and lots sold have not reached the record levels in 2017 and 2021, higher prices propelled dollar volume of sales above those years. Prices continue to rise, for both lots and homes:
The blue line represents the average closing price for waterfront homes each year, and the red line represents average lot price. Both have risen sharply since the pandemic.
Compared to 2019, the year before Covid hit, the average waterfront home on Lake Wylie has increased from $775,000 to $1.4 million — an 83% jump. Waterfront lots have gone from $260,000 to $625,000, up 137%.
During the same time frame, the prices of non-waterfront homes in our area have increased 58%. The premium for waterfront property has widened. In 2019, the average price for a 3500 square foot waterfront home was about $725,000, compared to $450,000 for a similarly styled and sized home off the water — a premium of about $275,000. Today, a buyer might pay $1.3 million for that same home on the water, compared to $740,000 off the water — closer to a $600,000 premium for a similar house waterfront.
Waterfront lot prices continue to rise as increased development limits available inventory. Buyers are paying top dollar for lots in McLean neighborhoods in Belmont, with an average price this year of $765,000 for a lot under an acre in size.
Elsewhere on the lake, some of the notable sales for lots include:
  • 1.5 acre lot on Squirrel Lane in Lake Wylie – $785,000
  • 0.4 acre lot in Joslin Pointe in Rock Hill – $590,000
  • 2.4 acre on Dam Road in Fort Mill – $1.5 million
  • 1 acre lot on Youngblood Rd. In Charlotte – $600,000
Home sales by price
Most waterfront homes in the past few years have closed at prices over $1 million:
In the chart above, the percentage of sales by price segment each year is represented by colors: dark blue (under $500k), red ($500-$699k), green ($700-$999k), purple ($1-$2 million) and light blue ($2 million plus.)
Until the pandemic, a sale over $2 million on Lake Wylie was quite rare. Now more than 20% of sales exceed the $2 million price tag. Pre-pandemic, more than half of the sales were priced below $700,000. Now that segment represents less than 10% of sales.
Other notable trends in the market include:
  • Homes are taking a little longer to sell this year. The average waterfront home is on the market 41 days before going under contract, compared to 35 days last year.
  • 25% of current listings are priced over $2 million. The average asking price for waterfront homes on the market right now is $1.8 million.
  • There are only 14 waterfront homes currently under contract on Lake Wylie. Typically, this time of year, there are 25-35 homes under contract. Lack of inventory in the lower price categories and persistently high interest rates may slow down summer sales.
  • Off the water, home sales in the Lake Wylie region (six-zip code area around the lake) are down 5% compared to last year. Prices are up about 3%.
  • Across the greater Charlotte region, inventory levels for residential homes are up 22% compared to last year. The average time on market is 28 days — compared to just 13 days in summer of 2022.
As inventory levels climb and the time on market increases in our extended region and in other markets feeding buyers to Lake Wylie, we expect to experience more slowing in the time it takes to sell waterfront properties. From our team’s recent observations and in conversations with other realtors, we’re seeing more buyers offering contingent contracts — something we haven’t encountered often during the buying frenzy of the past few years.
If you’d like to discuss market trends and how they might impact your property, please give me a call. I’d welcome the opportunity to talk with you.
Check out my website pages, Recent Waterfront Home Sales and Recent Waterfront Lot Sales, to see more details about this year’s real estate activity on Lake Wylie.
Thanks for reading, and have a great summer!

Lake Wylie – Let the summer begin

Summer is in full swing, and the Lake Wylie waterfront real estate market is heating up! Listing inventory for lake homes increased dramatically in May — reaching levels we haven’t seen since mid-2021. Waterfront lot listings are holding steady, however, showing no growth in the past three years.

Highlights of the waterfront market “at a glance”:

Waterfront Lot sales

While lakefront prices for homes are up modestly compared to last year, dockable lot prices have skyrocketed. On average, buyers are paying as much for an undeveloped waterfront lot as they were paying for a waterfront house ten years ago.

Waterfront lots in the McLean developments in Belmont are selling for prices averaging in the high $700’s. Other premium-priced sales this year include a 1.5 acre lot on Squirrel Lane in Lake Wylie ($785,000), a 2.4 acre parcel on Dam Road in Fort Mill ($1.5 million) and a one acre lot on Youngblood Road for $600,000.

The average listing price of waterfront lots right now is about $750,000, with two thirds of current lots listed over $500,000. Buyers are willing to pay premium prices for lots with big views, and tight inventory is driving up prices across the board.


Waterfront home sales

While listing inventory has finally begun to rise for Lake Wylie waterfront homes, the increases are concentrated in the highest price segment. The average listing price for lake homes is currently $1.8 million, with a quarter of listings priced over $2 million.

Average price per square foot for listed homes is about $460 — almost 20% higher than that of homes sold year to date.

After a strong start in January and February, sales for waterfront homes have settled into a pattern below the average for the past five years:

In the chart above, the blue line represents average number of dockable waterfront homes sold by month for the past five years, and the green line represents current sales. With just 17 homes currently under contract (about half the number typical for this time of year), we expect sales to lag below the average for the next couple of months.

The new levels of inventory — should buyers with higher budgets respond — ought to feed higher sales levels in later summer as the recently listed properties show, go under contract, and move towards closing.

We are living through exciting times in the real estate market. With the fast pace of sales and changes taking place, you’ll want to rely on the Lake Wylie agent with the most experience and knowledge. The Lake Wylie Man team has sold more lake property — by far — than any other agent in the area, consistently for the past 15 years.

For more details on recent lake sales, please visit my webpages, Recent Waterfront Home Sales and Recent Waterfront Lot Sales. Let me know if you’d like to discuss your property or if you have any questions about Lake Wylie real estate. Have a great summer!


Thanks,


Drew


Lake Wylie Real Estate market heating up for summer!

Summer is cranking up, and it has been fun to get out on the lake and soak up the sunshine!
We’ve seen a bump in listing inventory this month, with 49 waterfront homes now for sale on Lake Wylie. A year ago, listing inventory was only 25 homes — so 49 feels like a bonanza! Prior to the pandemic, we usually started the summer with more than 100 waterfront homes on the market, just for comparison.
Buyers shouldn’t look for a bargain, though. The price of waterfront homes sold year-to-date on Lake Wylie has reached an average of $1.3 million. The average price of currently listed lakefront homes has climbed to almost $1.9 million. Almost a third of the listings are over $2 million. Waterfront home prices have almost doubled in the past seven years, and mid-range listings are very scarce.
Depending on location and view, even “river cabins” (typically 2-3 bedrooms, under 1400 square feet, 50+ years old) are selling for an average of $700,000, with some topping the million dollar mark.
Below is a graph of prices for “cabin” properties as of the end of 2023:
In the chart above, the blue bars represent the number of cabins sold each year, and the red line represents the average price. Prior to the pandemic, most of these properties sold for well under half a million. The higher demand for lake property — any lake property — caused a dramatic spike in prices. Many of the higher-priced cabins feature updates, particularly in the bathrooms and kitchens, which have added considerable value. But even “vintage condition” cabins are selling quickly and at strong prices, particularly if they offer desirable locations and views.
Lakefront lots are still very scarce on the market. Inventory remains at just 25 dockable lots on the market, about the same as last year, with very little change from month to month. To date, 17 dockable lots have sold this year, for an average price of $630,000. About a third of them were in McLean developments in Belmont, where the average price is just over $800,000 for lots averaging 0.8 acres. Premium lots with big open views across the lake are commanding higher prices as well.
We are entering the height of the market, seasonality-wise. Typically, summer months bring the largest share of buyers, and we expect no difference this year. Waterfront homes benefit from “drive-by” traffic on the lake, with boaters out enjoying the sunshine and daydreaming about their own place on the lake. The chart below, which represents when Lake Wylie waterfront homes closed, lags 6-8 weeks from when the contract was written. For instance, a July closing date represents a home that most likely went under contract during May-June.
In the chart above, the blue line represents the number of dockable waterfront homes sold by month averaged over the past five years. The green line represents current year sales.
We kicked off 2024 with higher sales than is typical in January-February, then dropped below average the past two months. With the recent increase in listing inventory, we should return to average sales by mid-summer.
For more details on what has been selling, take a look at my webpages, Recent Waterfront Home Sales and Recent Waterfront Lot Sales.
If you are considering listing your home, there is no better time than the present. Prices are at an all-time high, and demand is strong (despite high interest rates!). I’ll be glad to talk to you about the estimated value of your home, as well as answer any other questions you might have. The Lake Wylie Man real estate team has led the waterfront market for the past 15 years, and with hundreds of transactions successfully completed, our experience on Lake Wylie is unparalleled.
Thanks for reading!
Drew

1st Quarter Lake Wylie real estate report

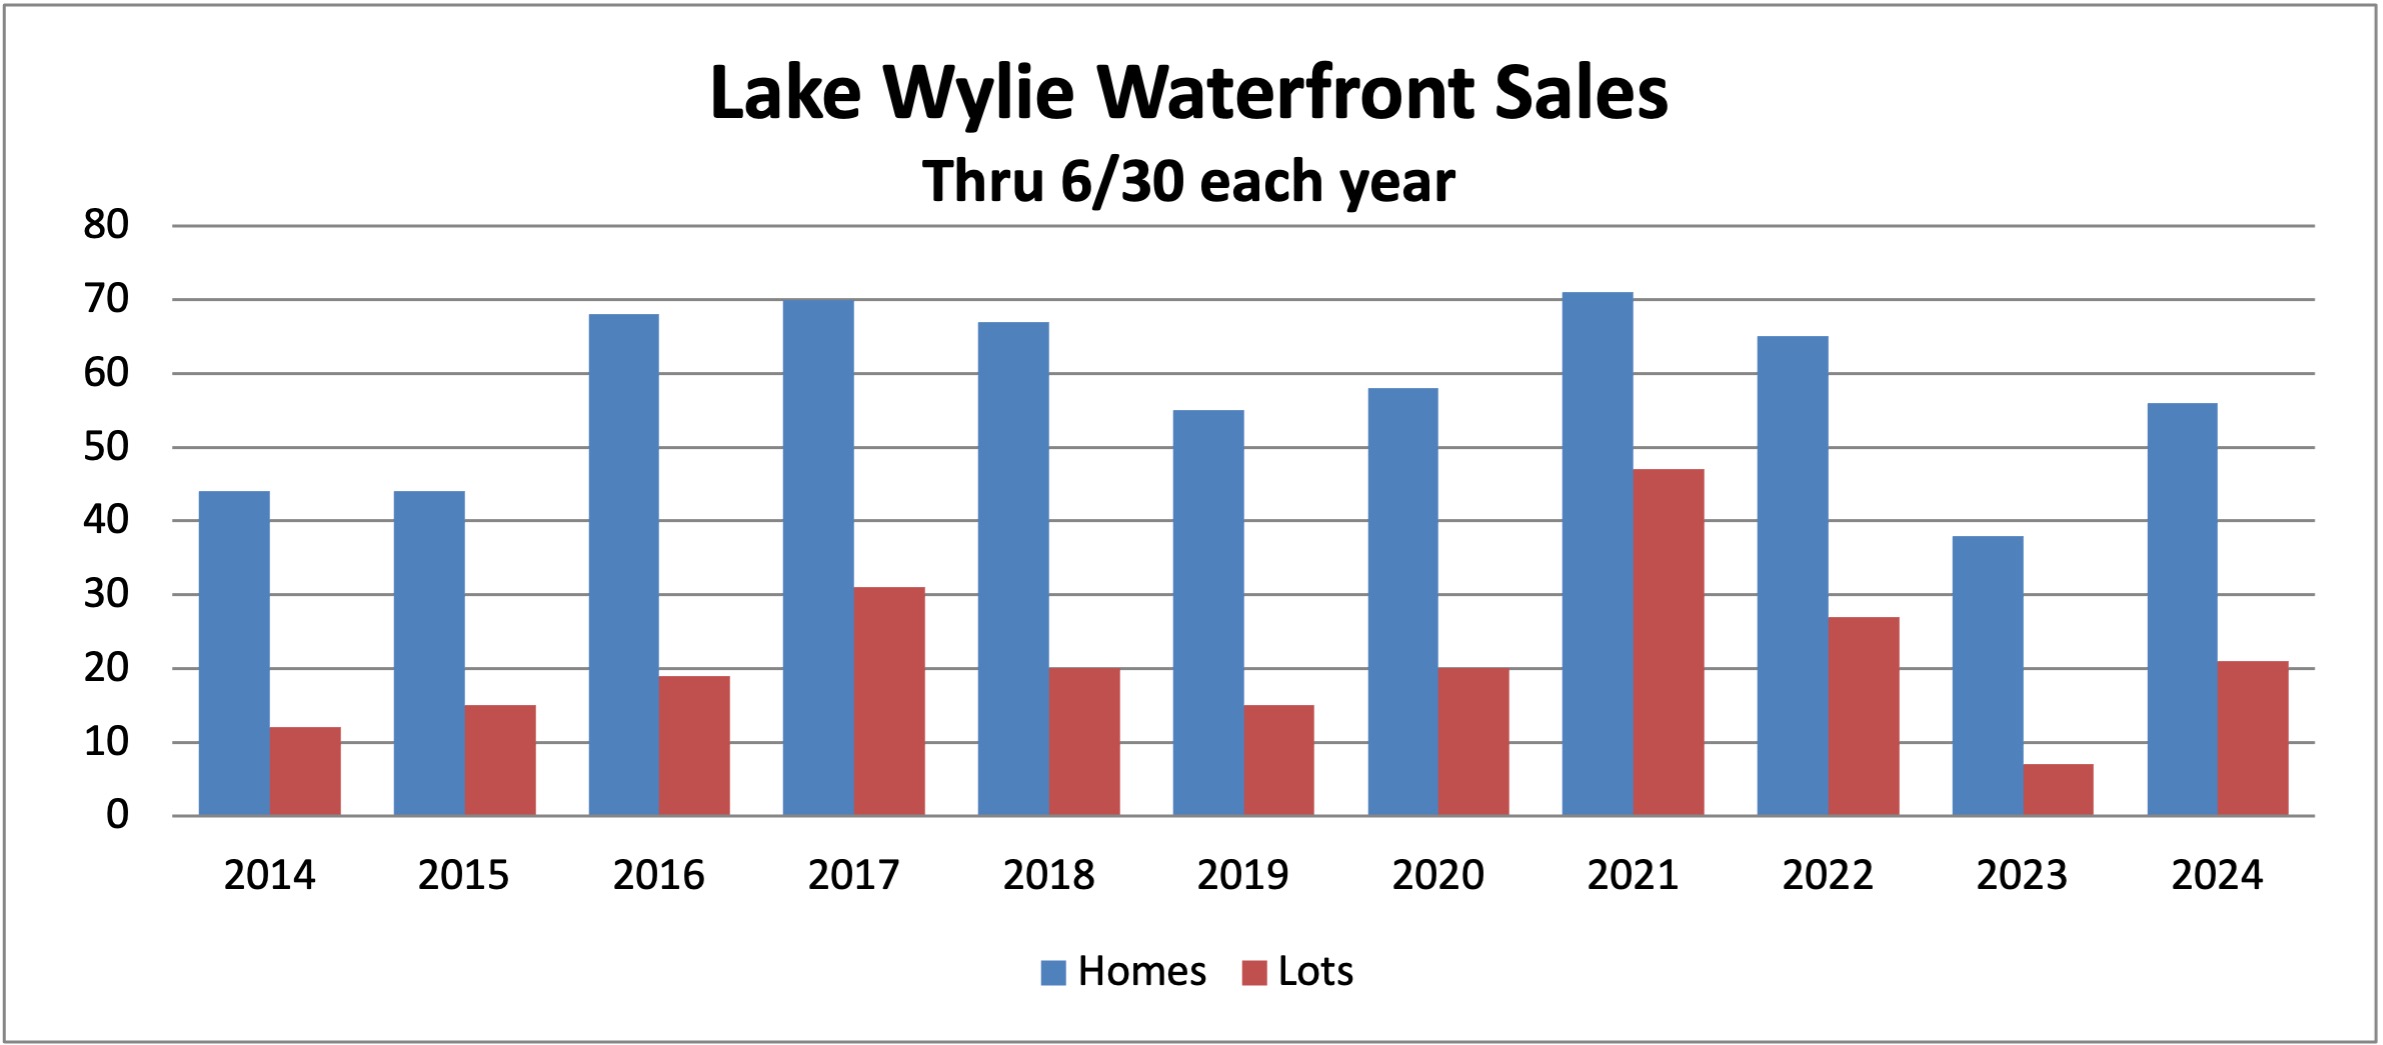
And just like that, the first quarter of 2024 is over. We’ve had a lively real estate market, with waterfront sales coming in at record levels:

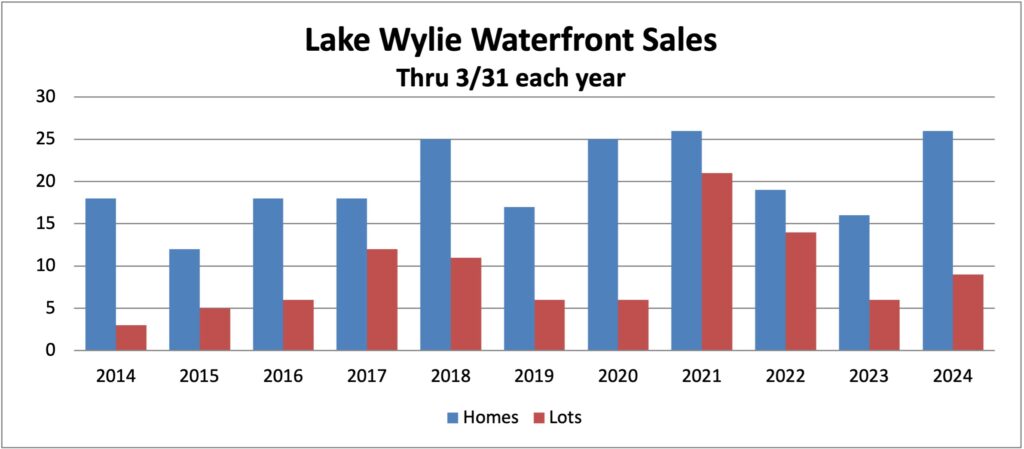
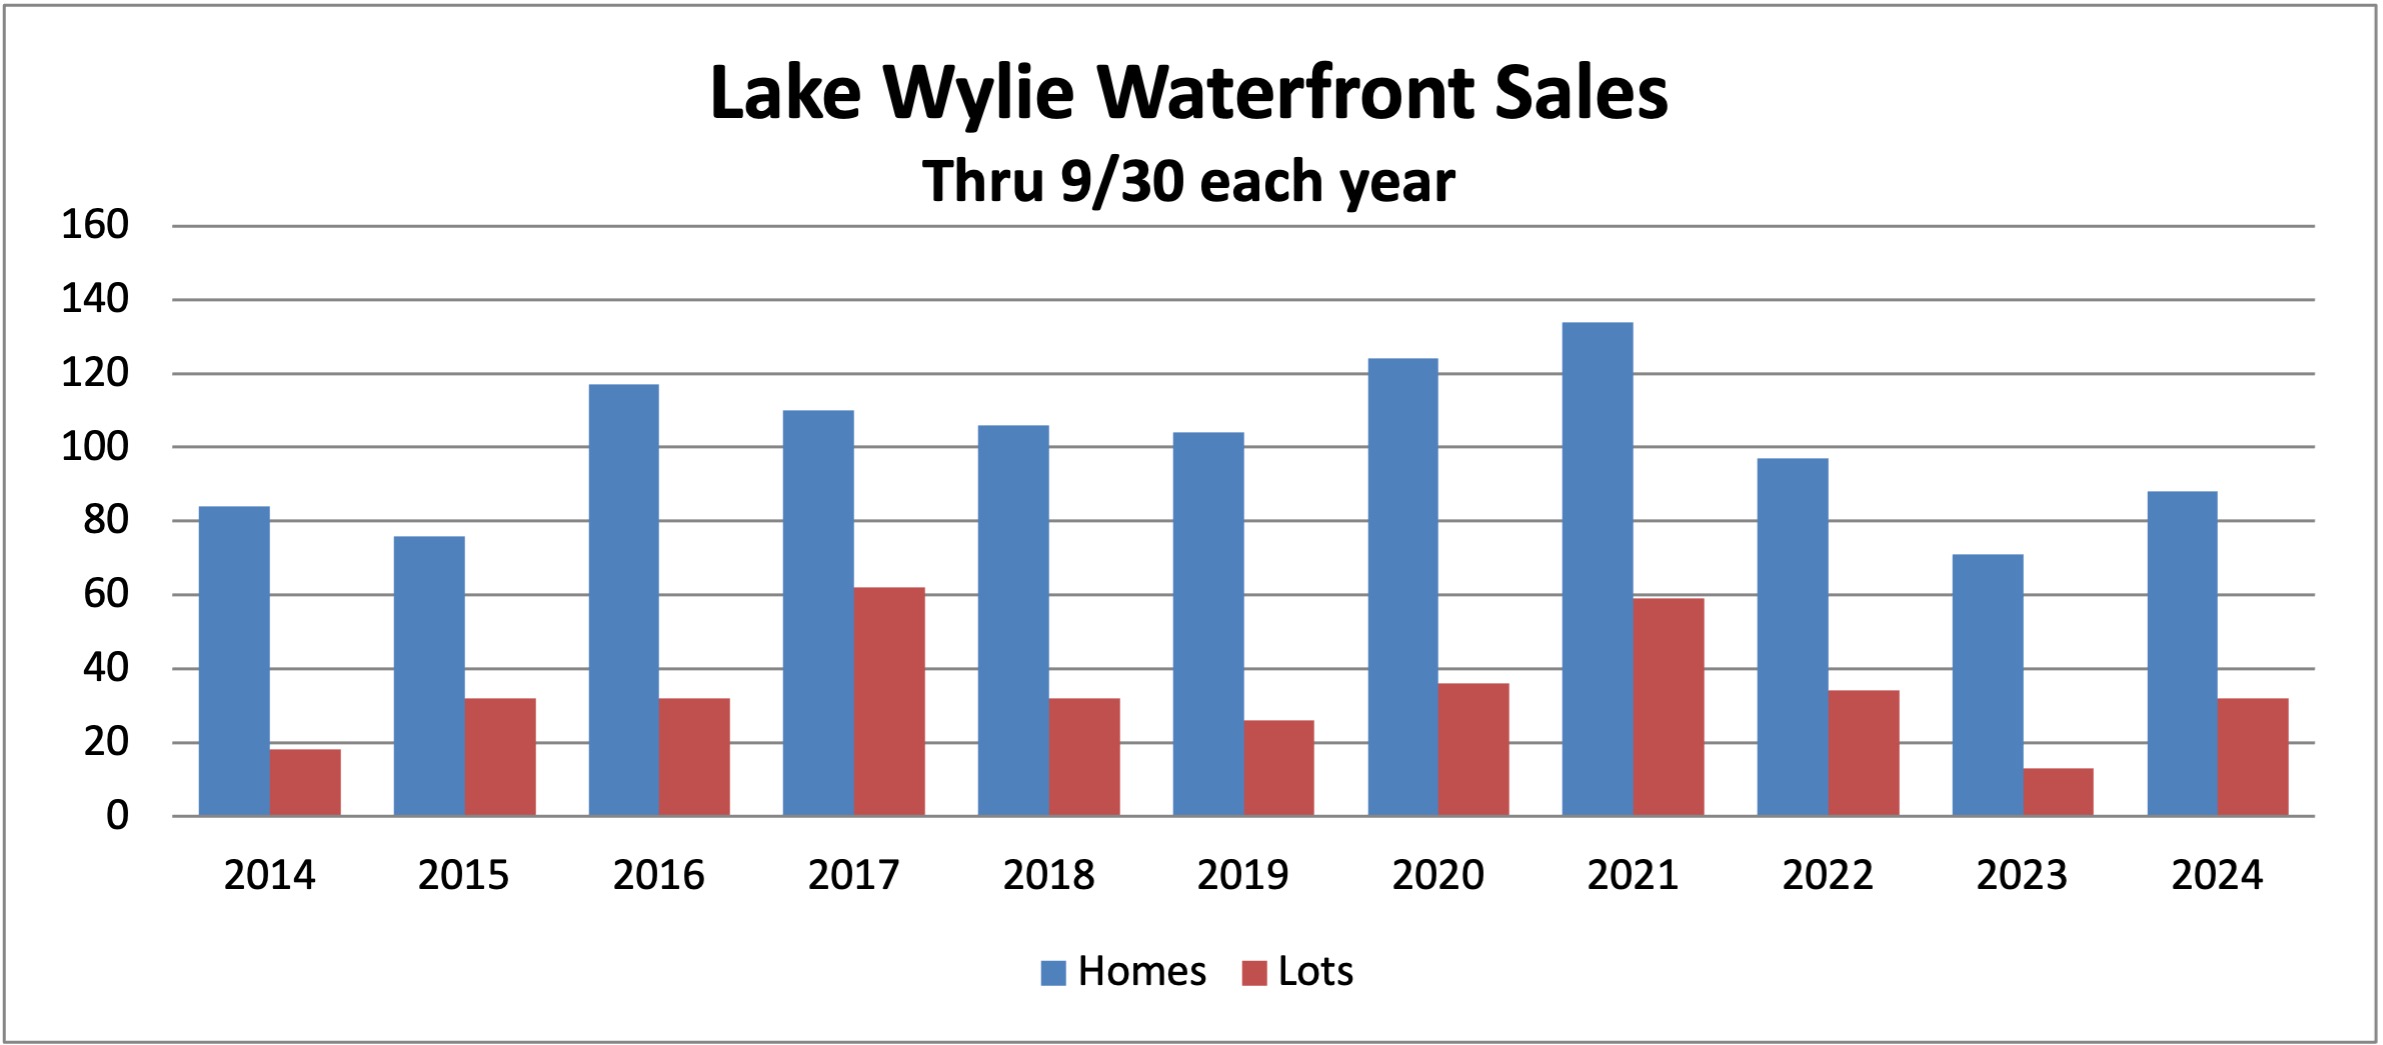
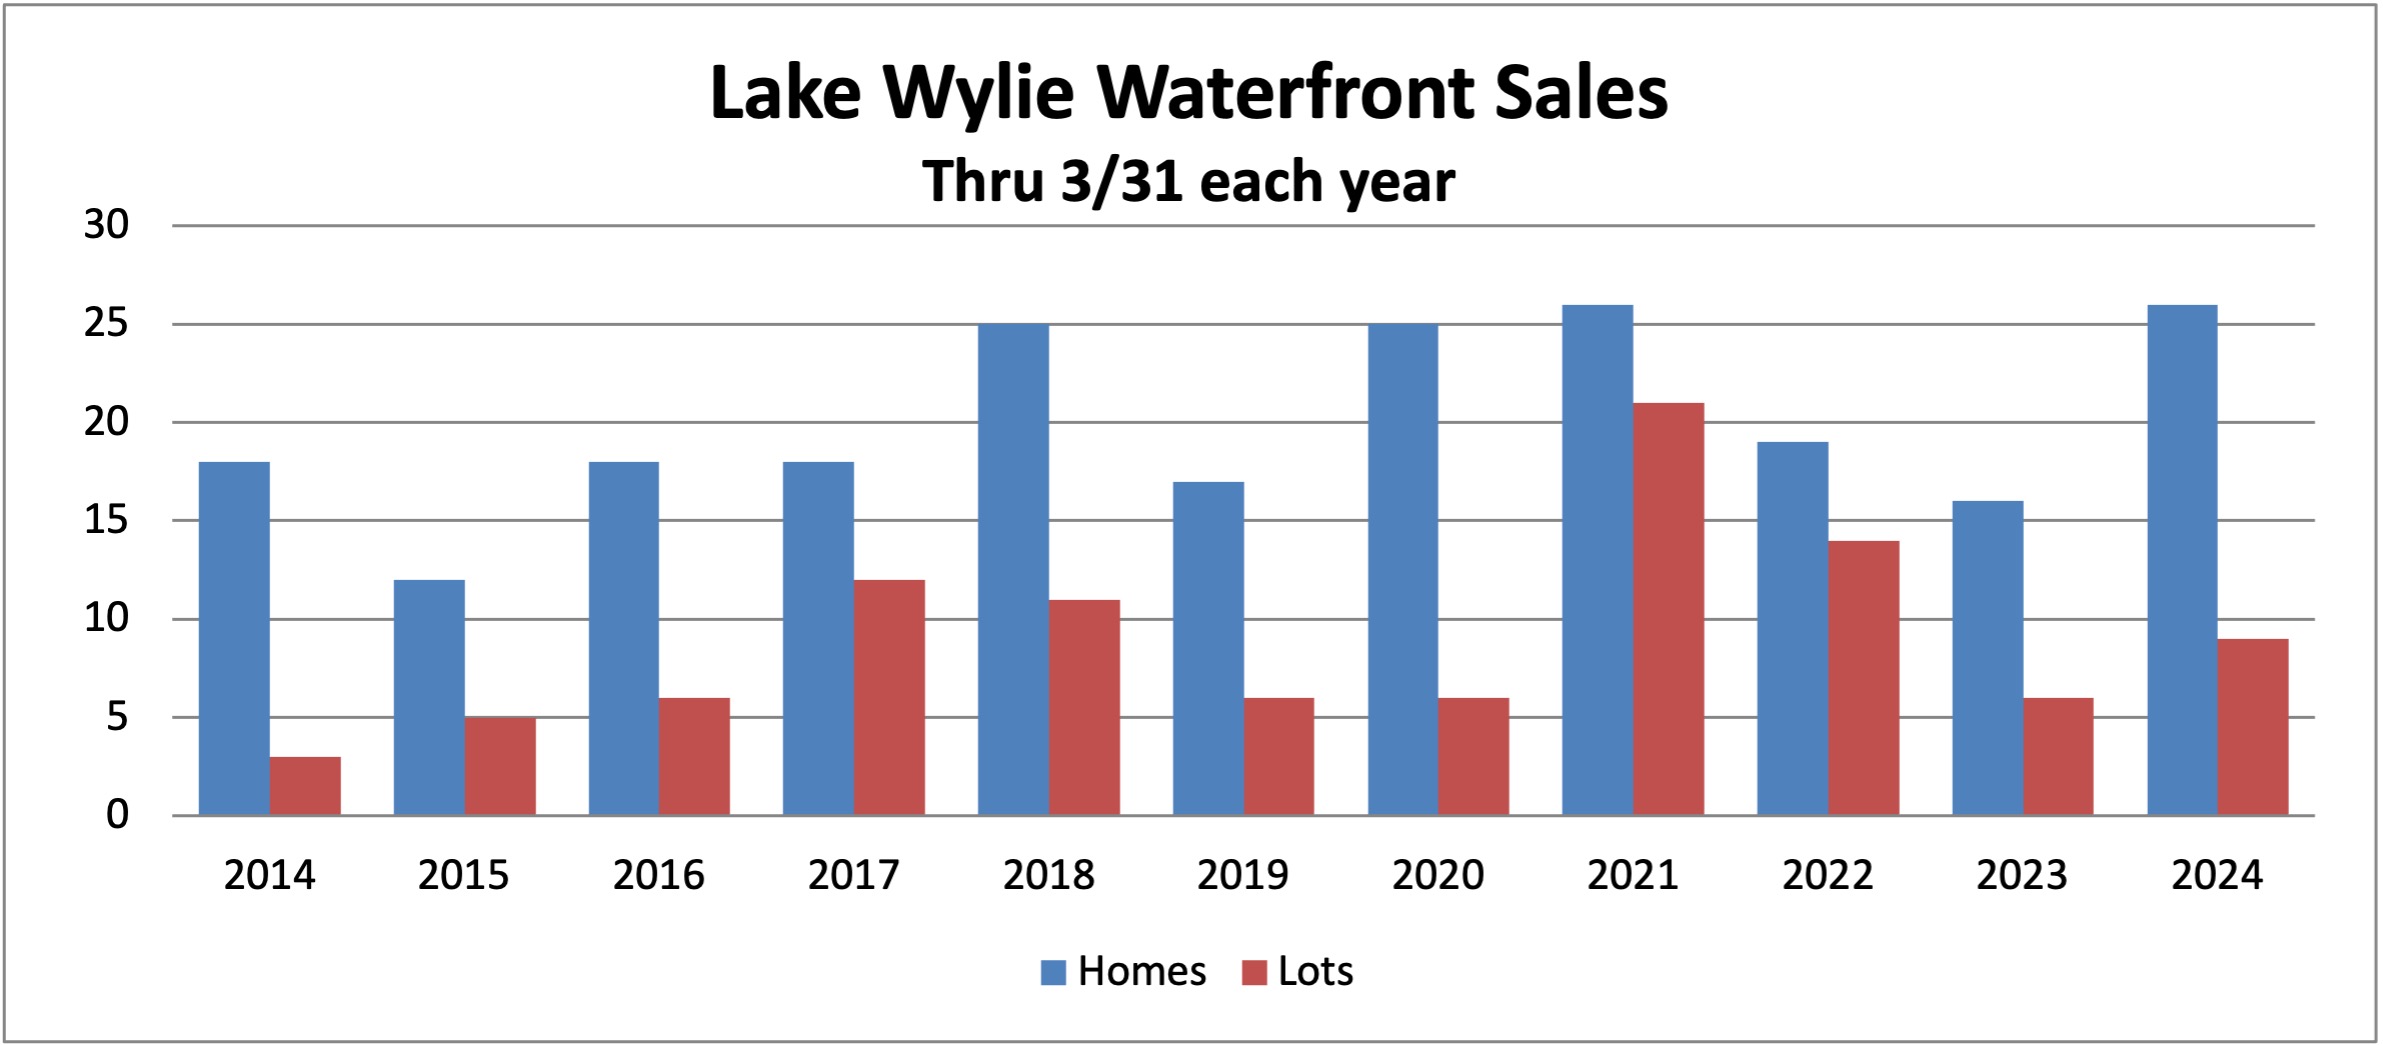
In the chart above, the blue bars represent the number of Lake Wylie waterfront homes that have sold in first quarter of each year. The red bars represent the number of dockable lot sales. 


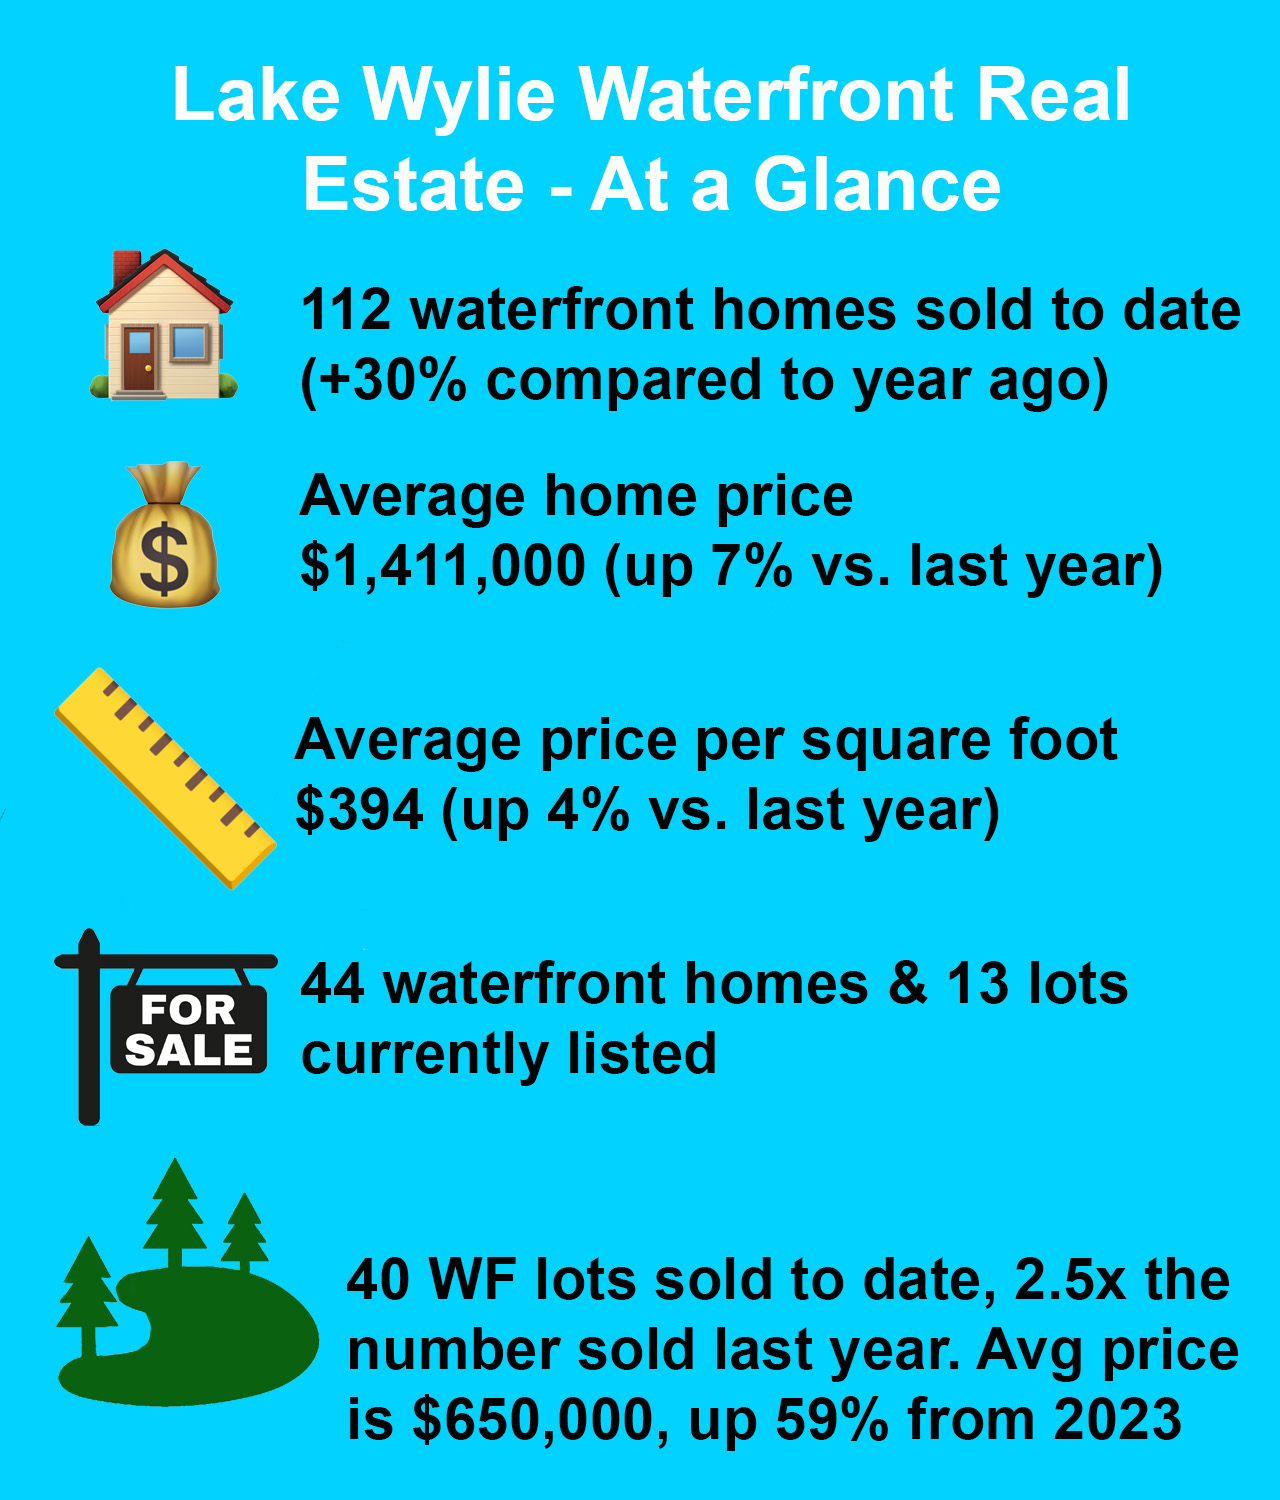
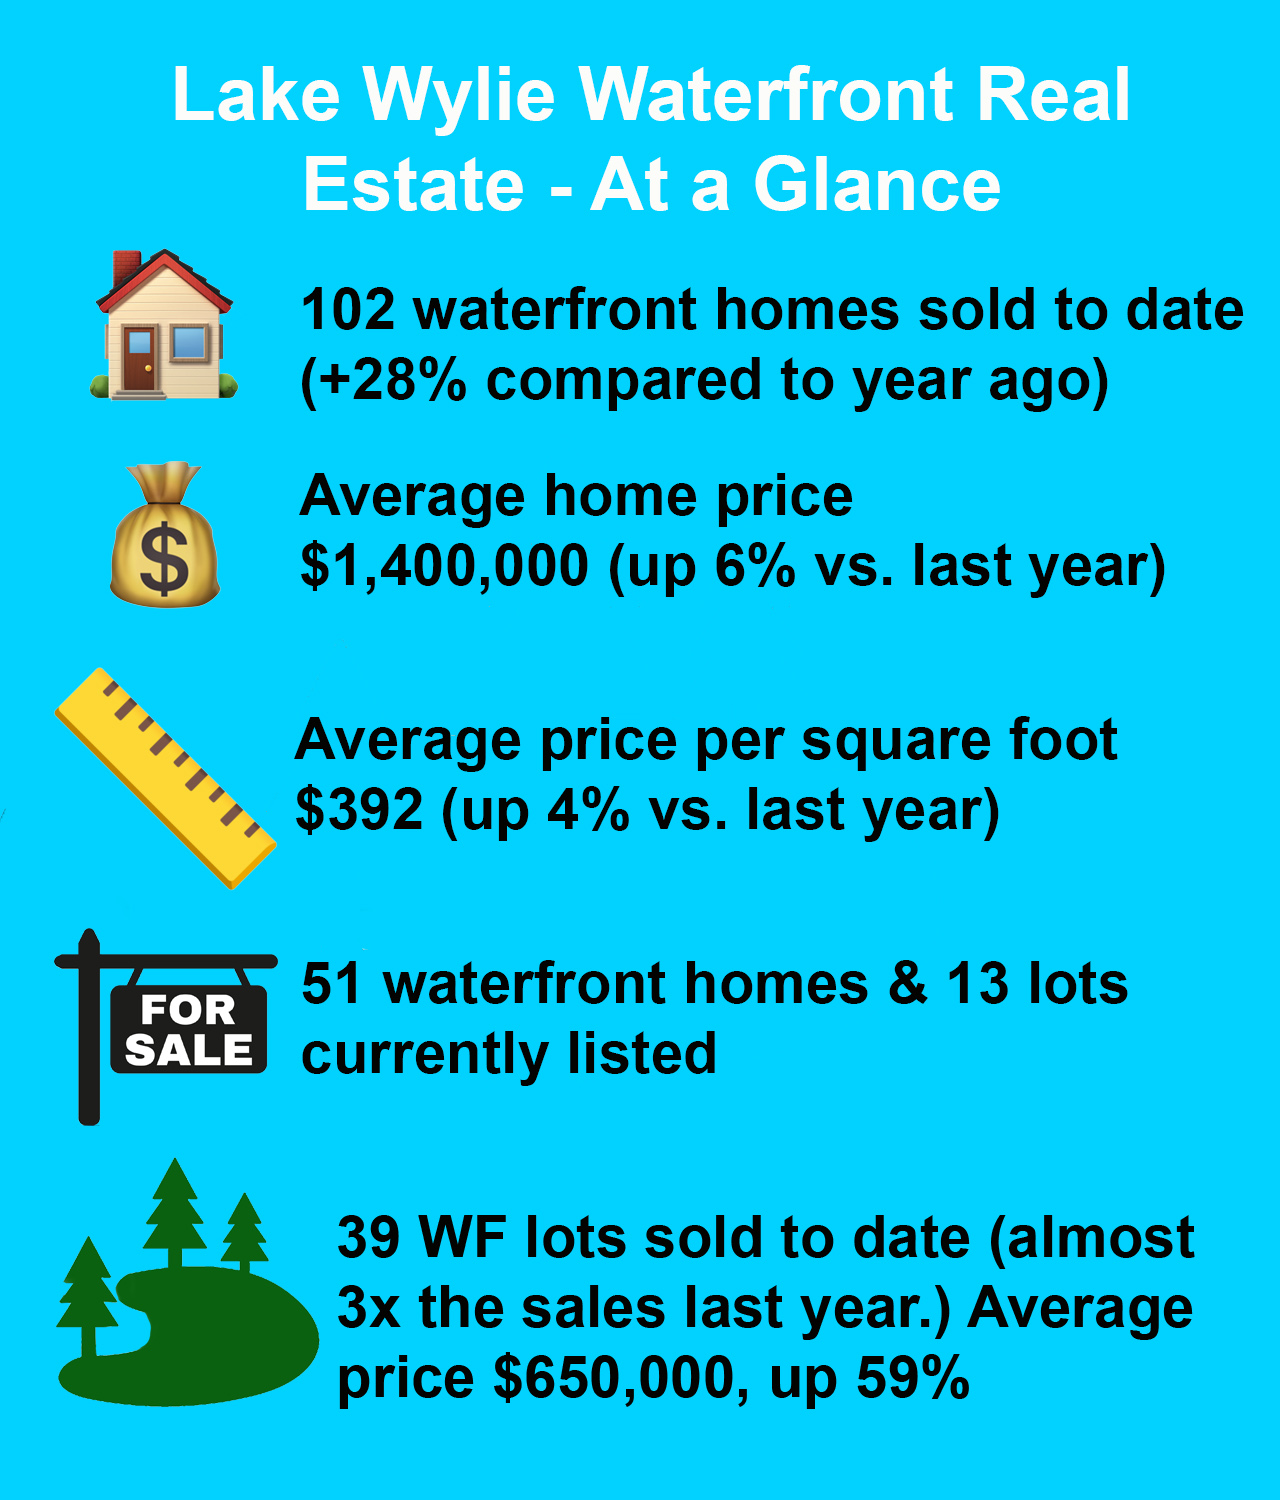
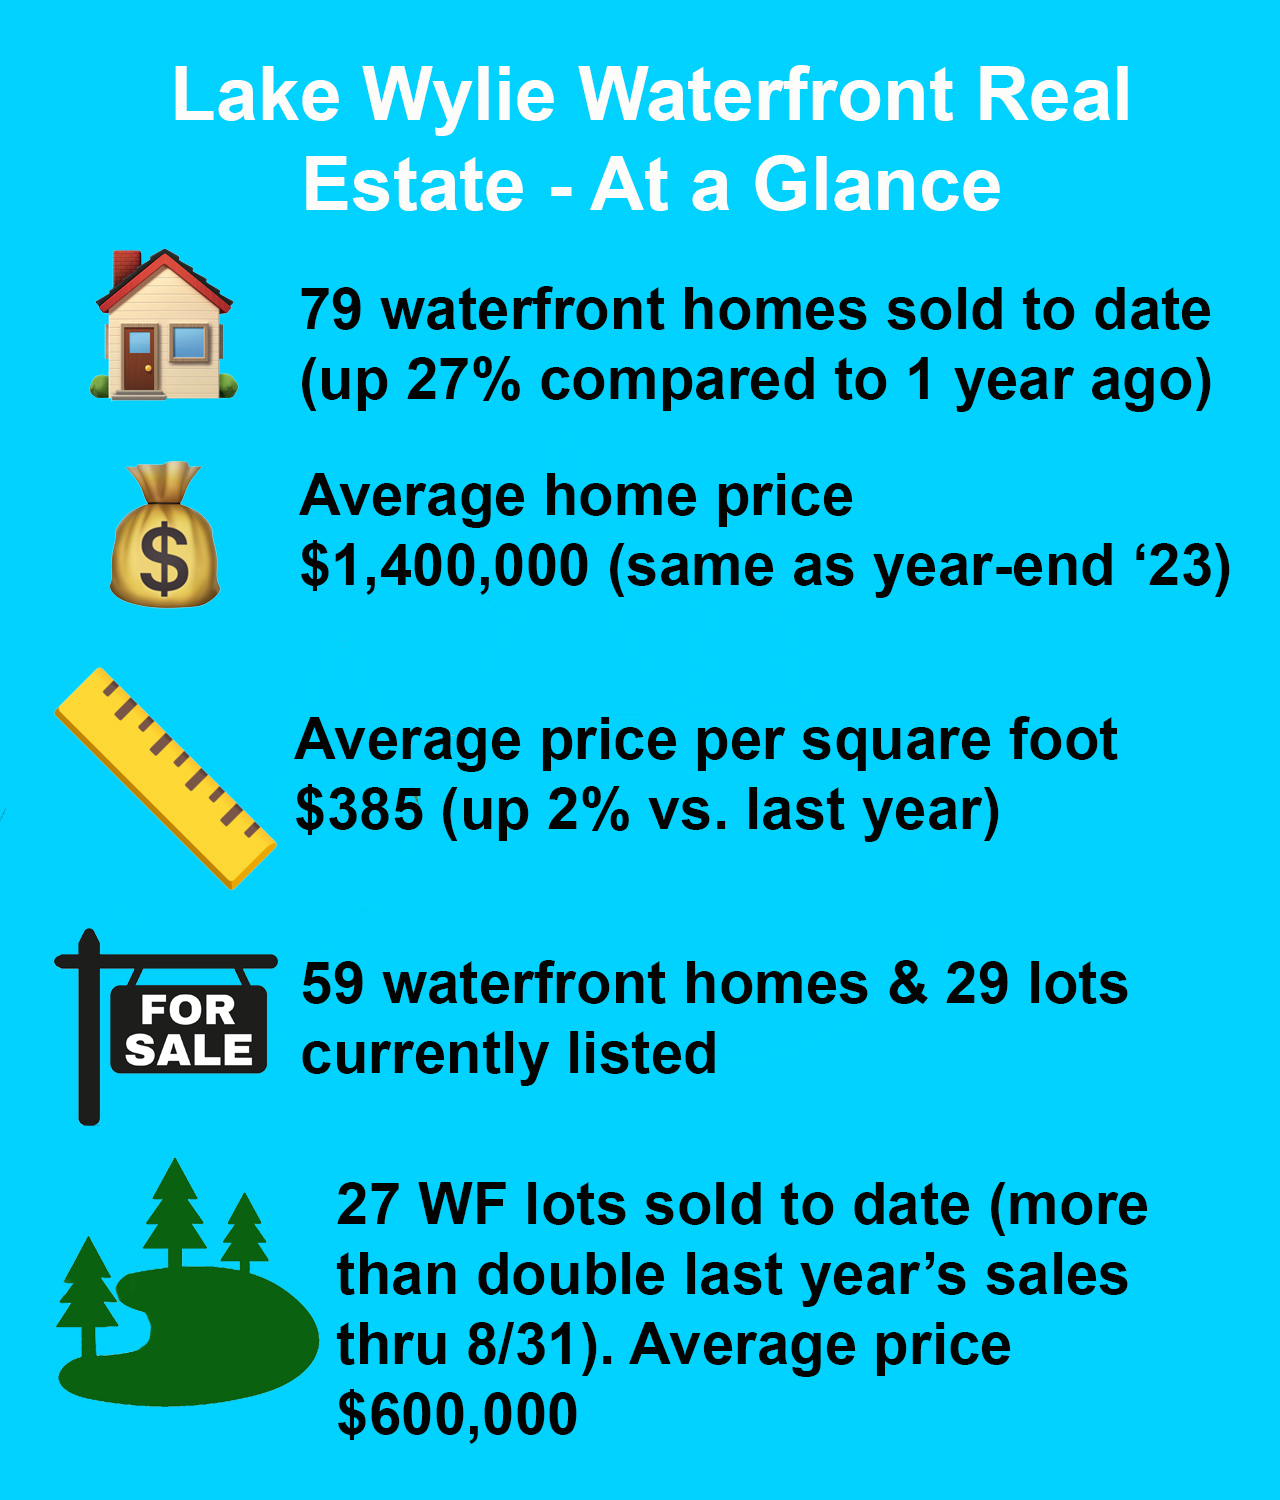
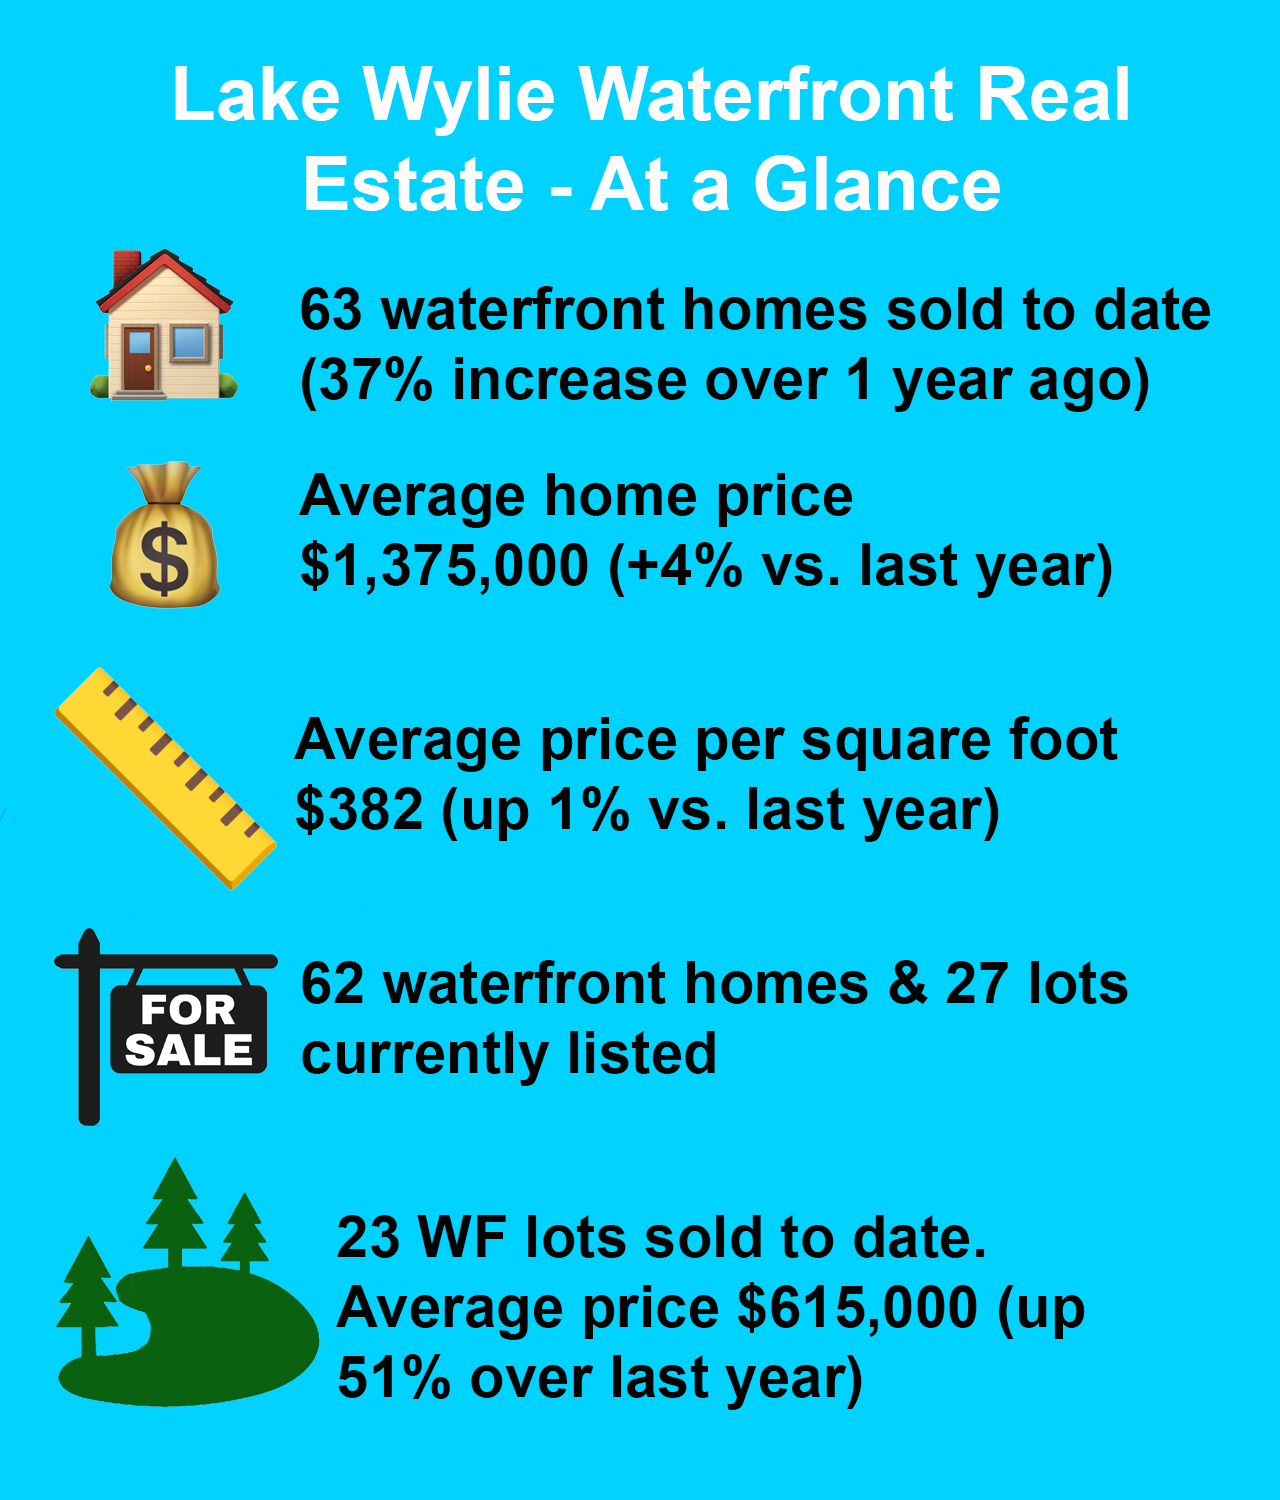
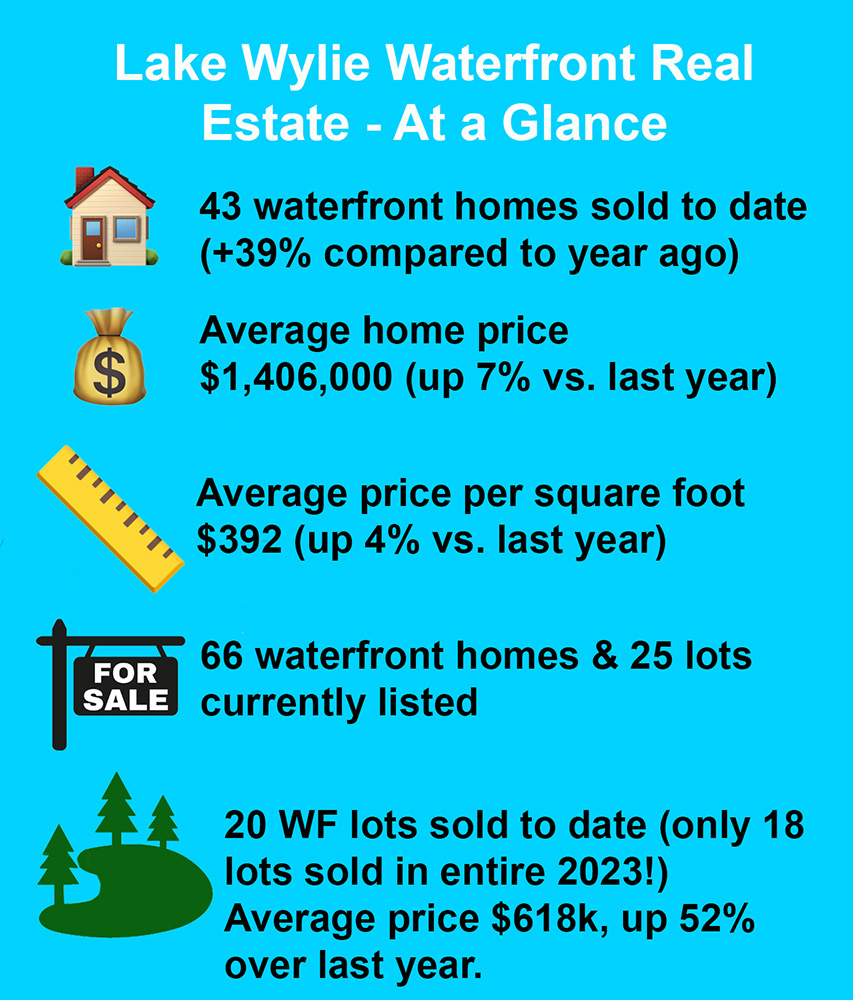
Waterfront real estate came out of the gate strong in 2024, posting home sales numbers equal to a record setting year in 2021. This is particularly impressive considering this year’s inventory levels (number of homes on the market) were 30% less than three years ago. 


Lot sales in first quarter of this year were about average in number, with available inventory less than half of what it was three years ago.


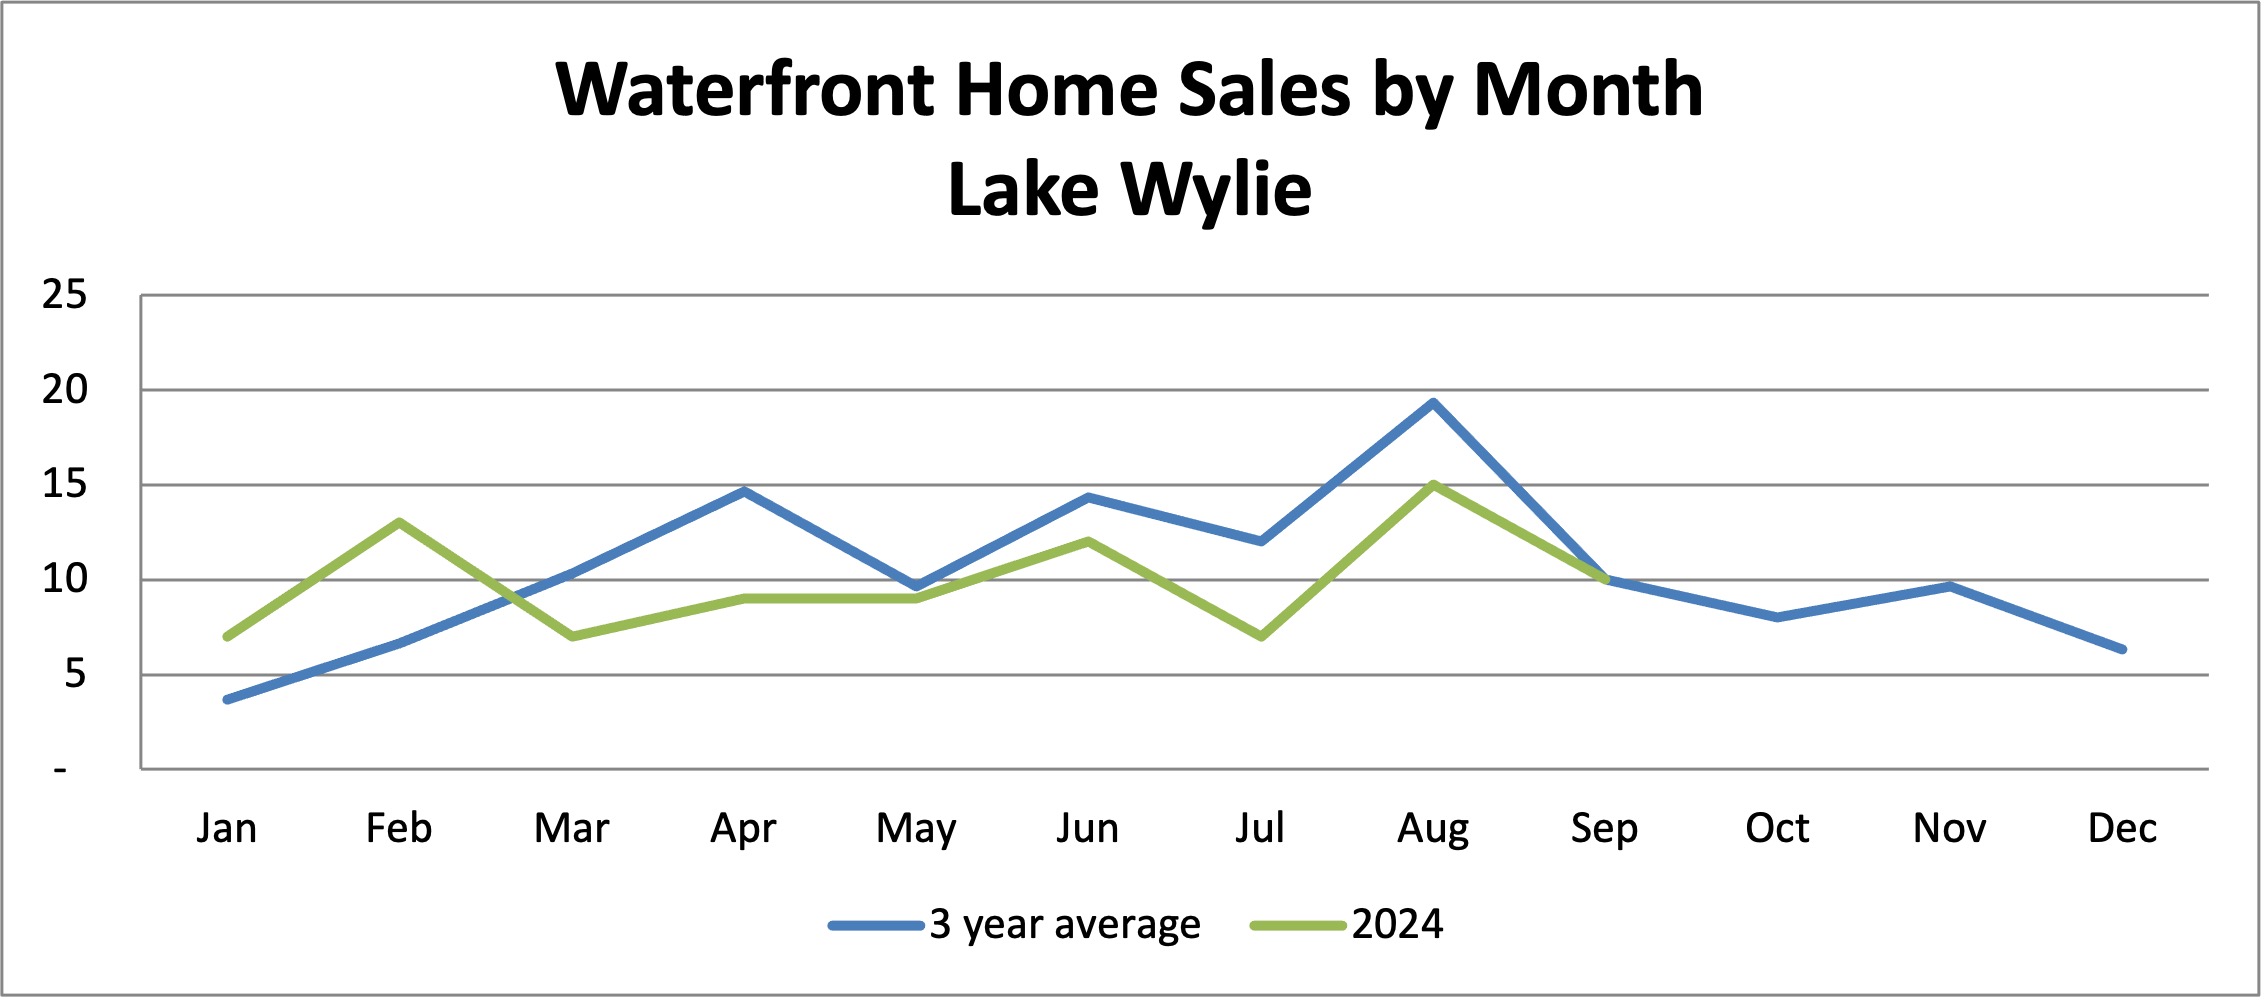
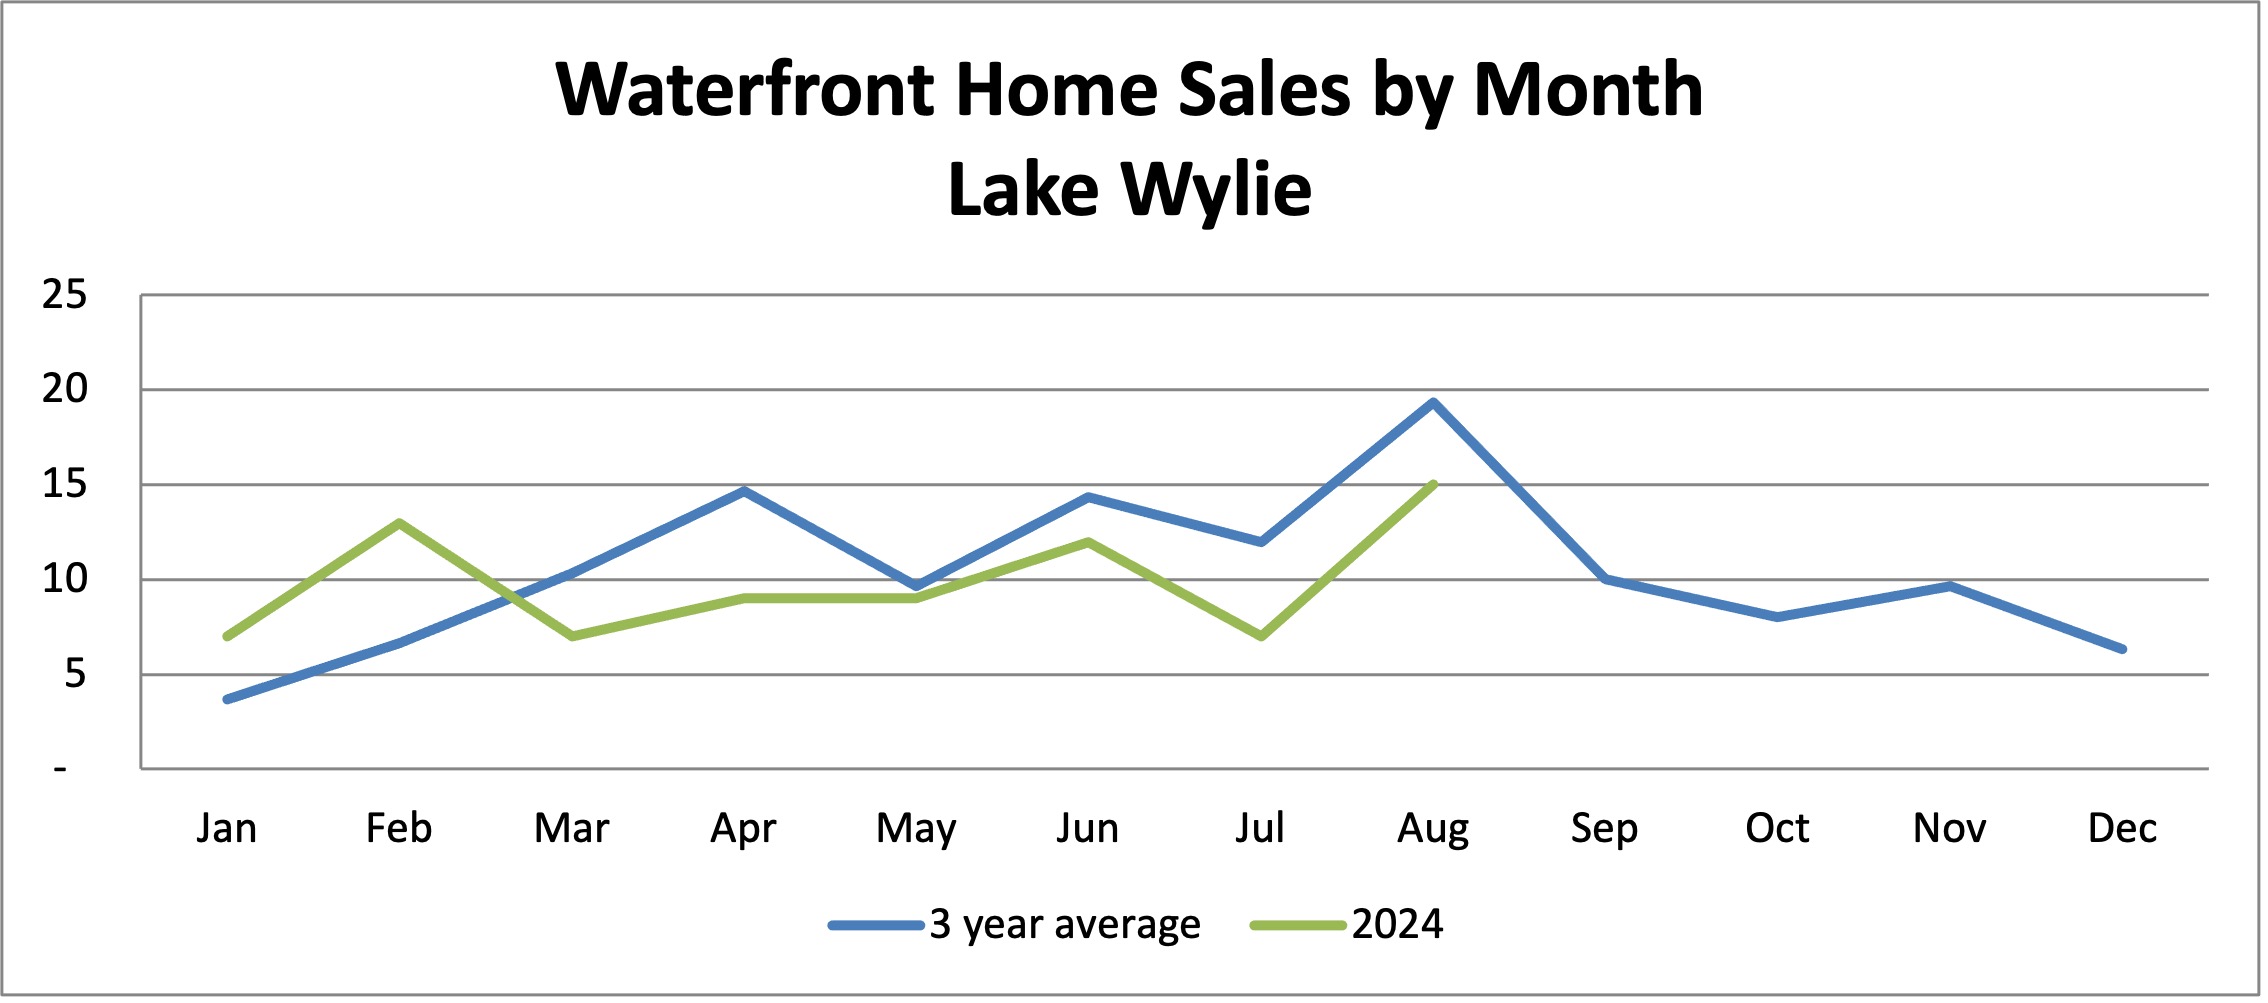
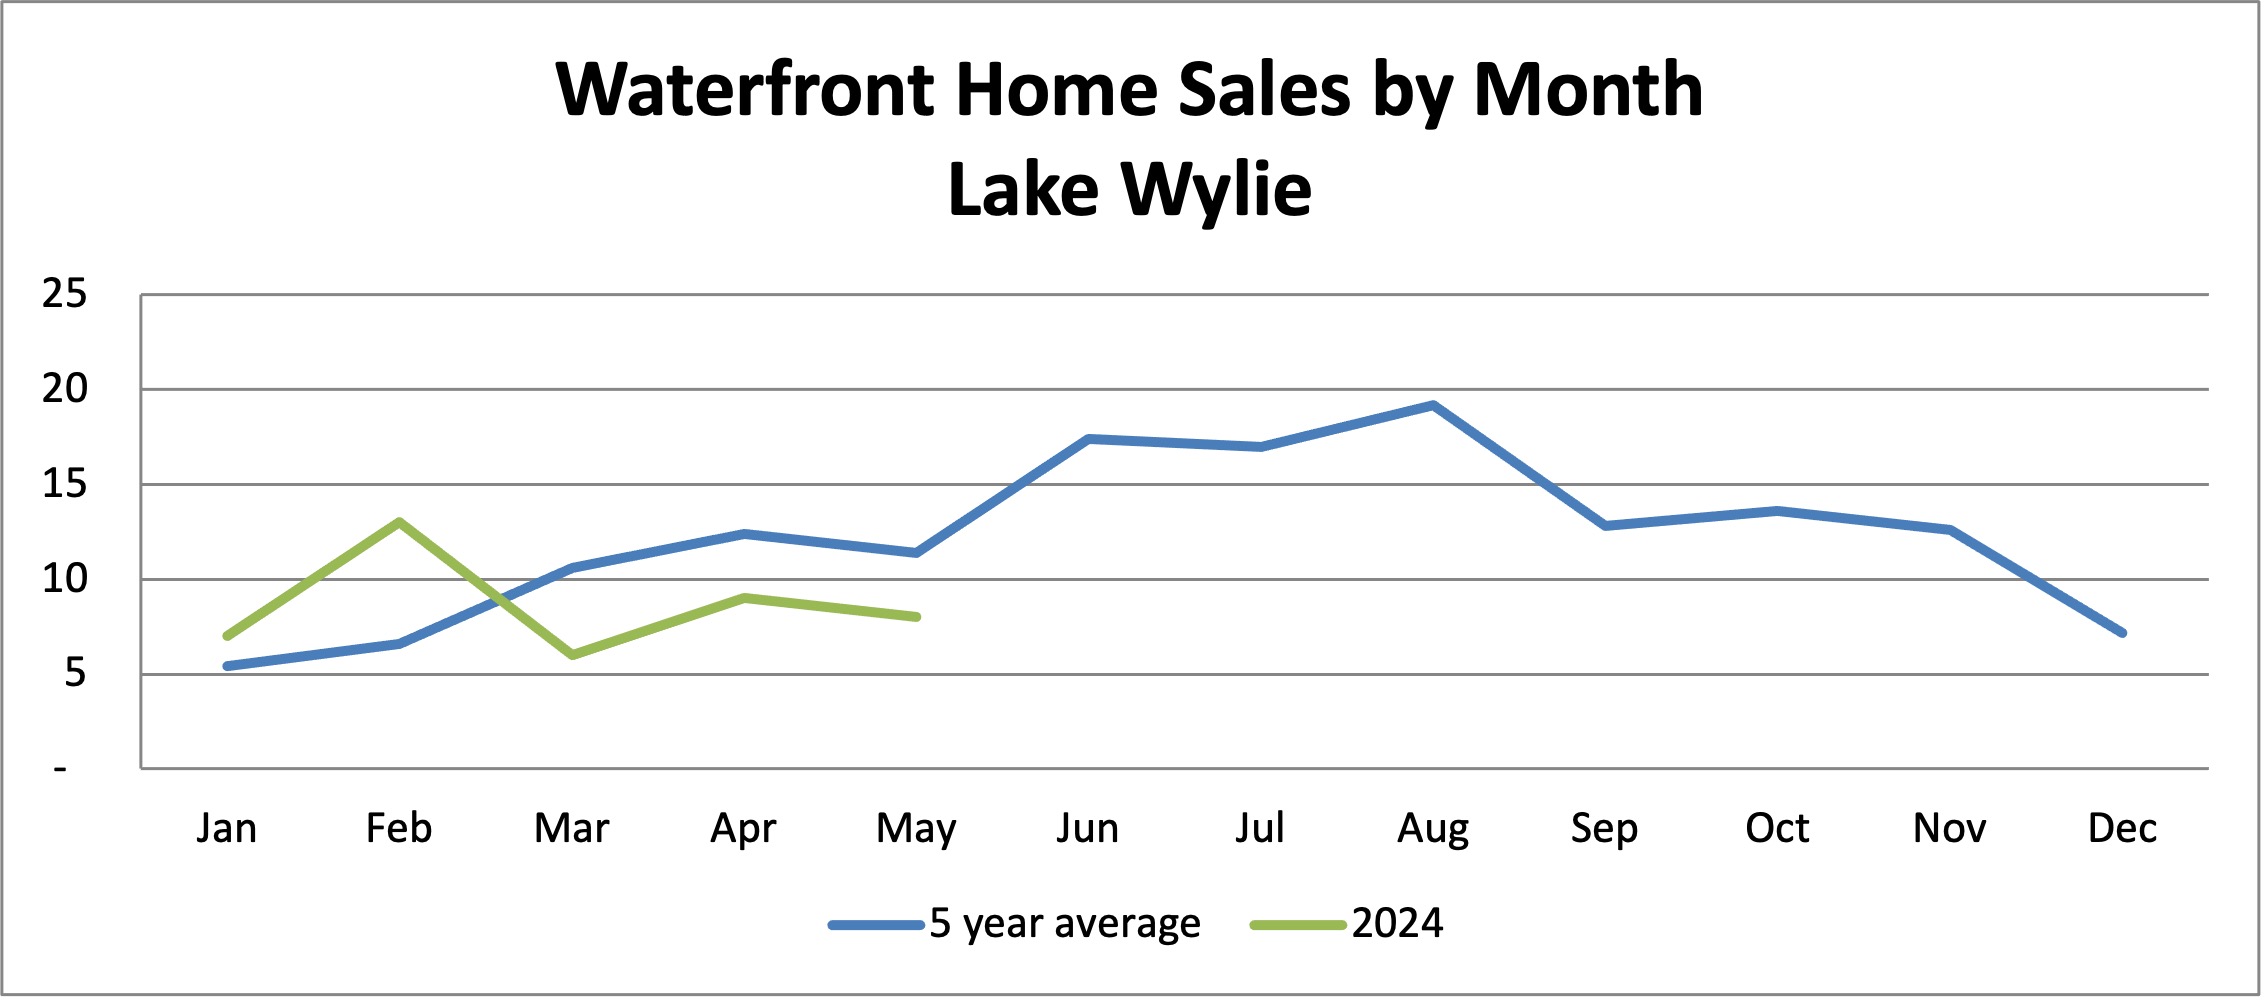
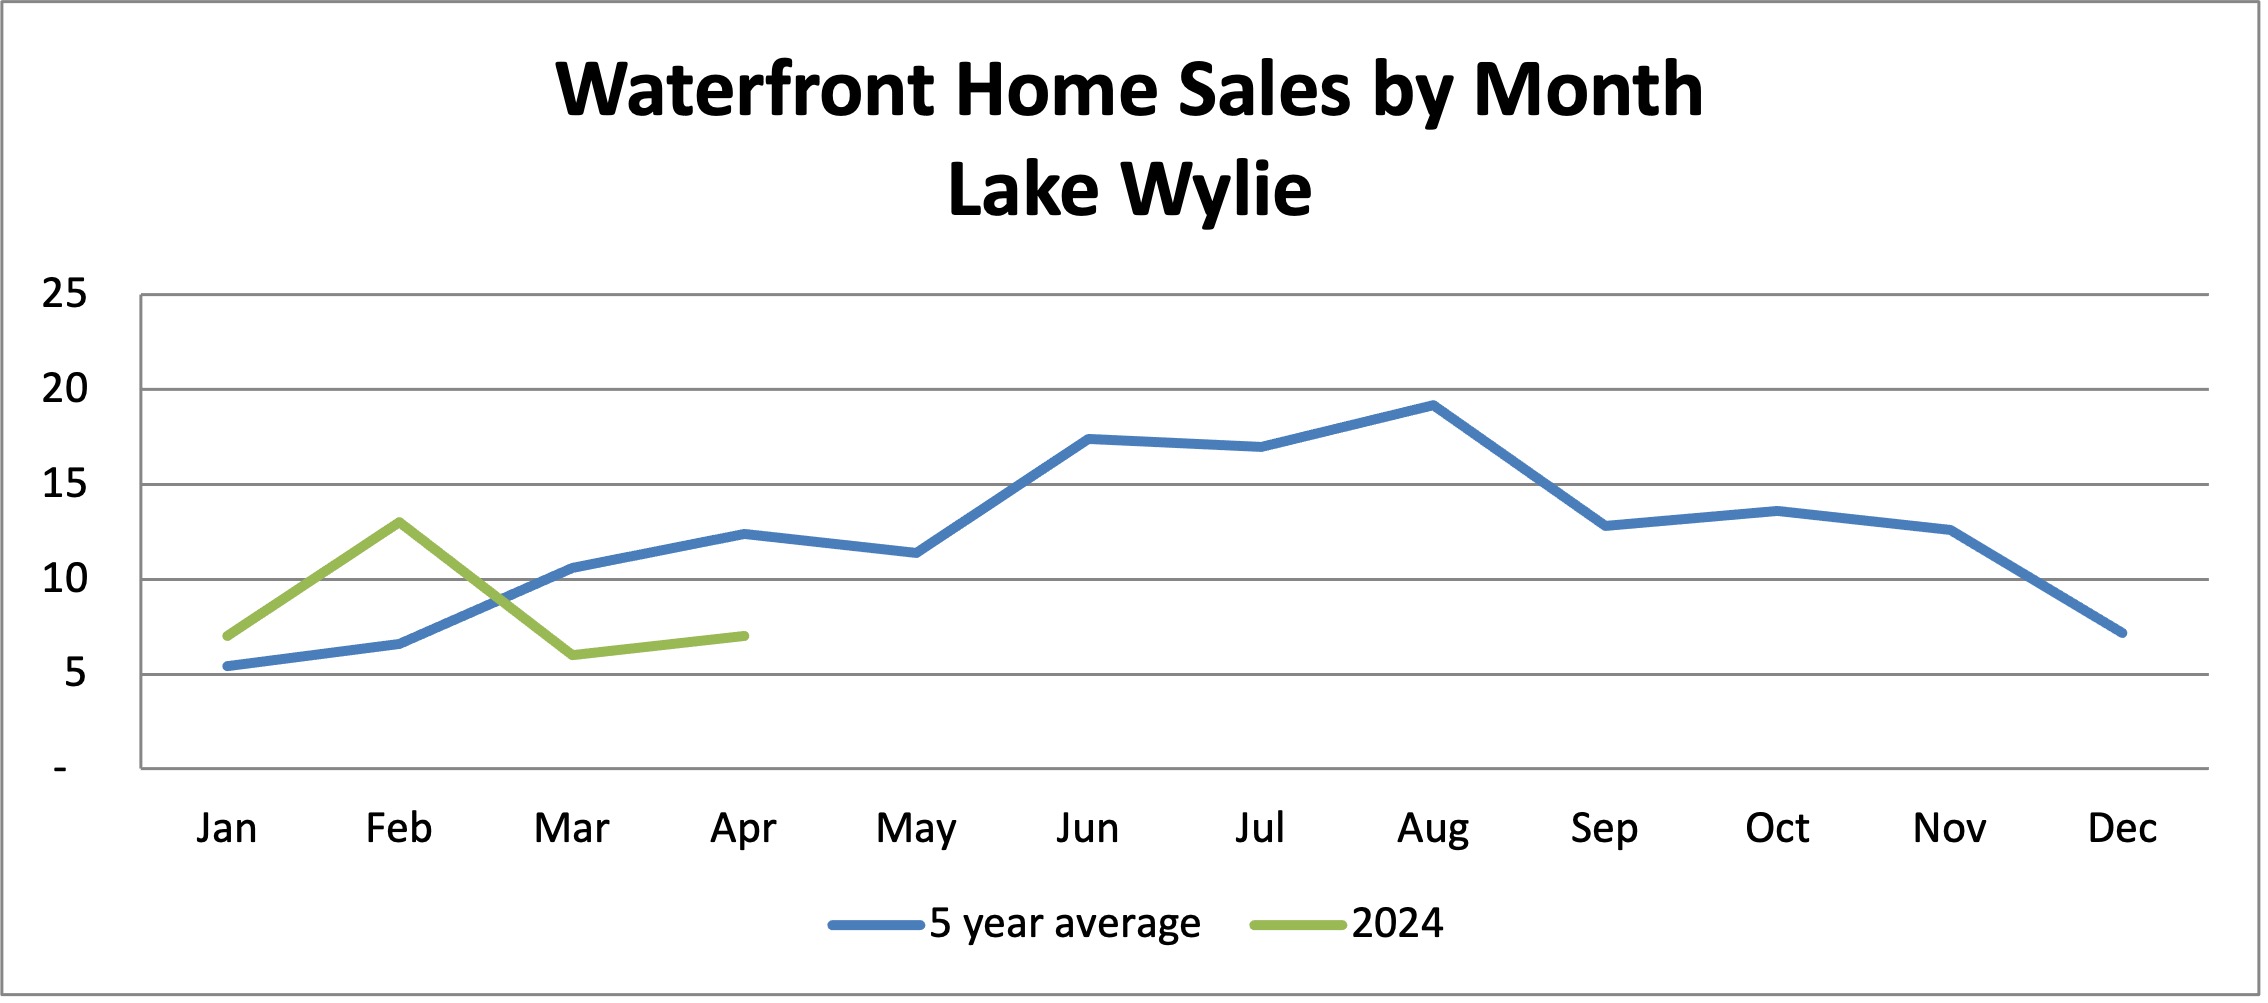
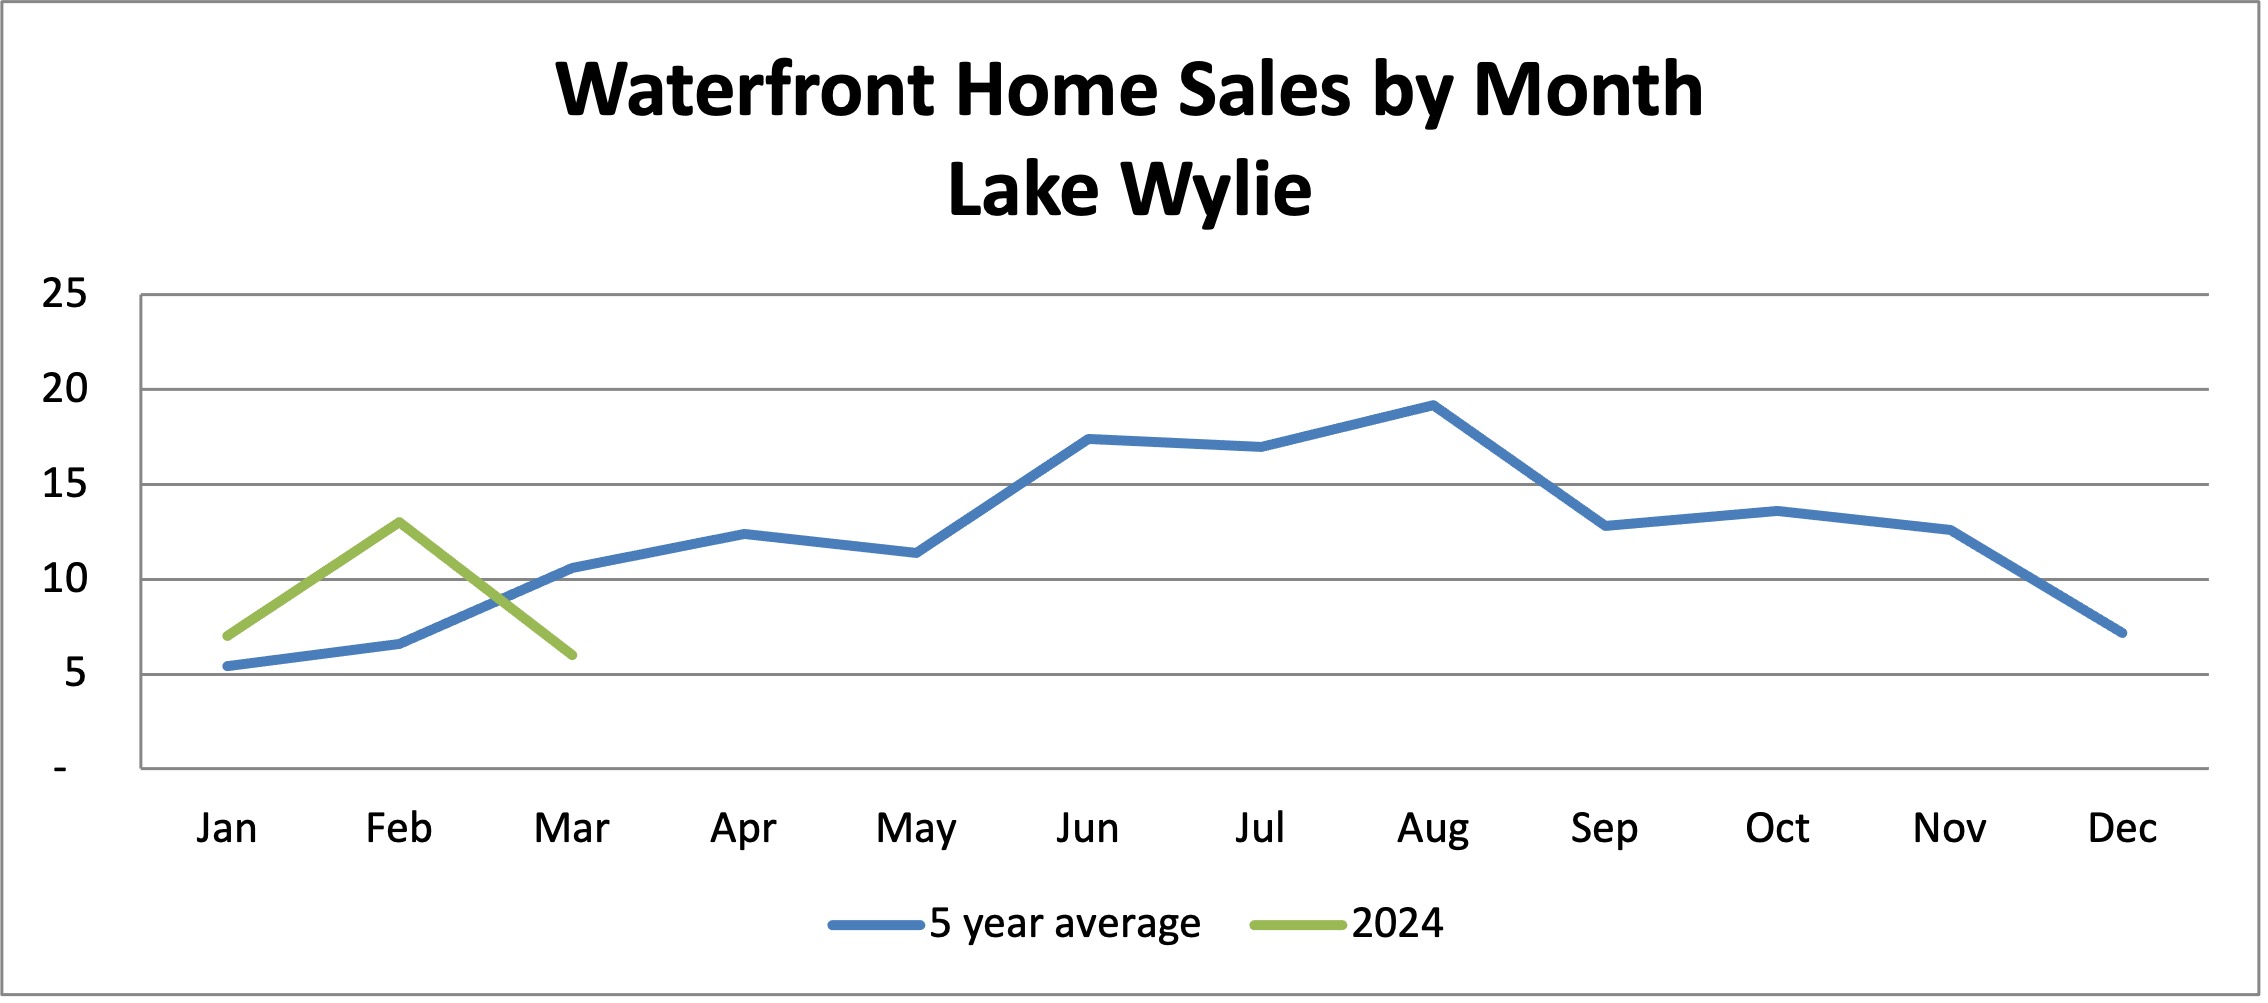
A caveat to consider is the short time period being compared. First quarter sales don’t always provide a reliable indicator of the year to come. January through March typically represents the slowest sales period of the year, illustrated in the following chart:

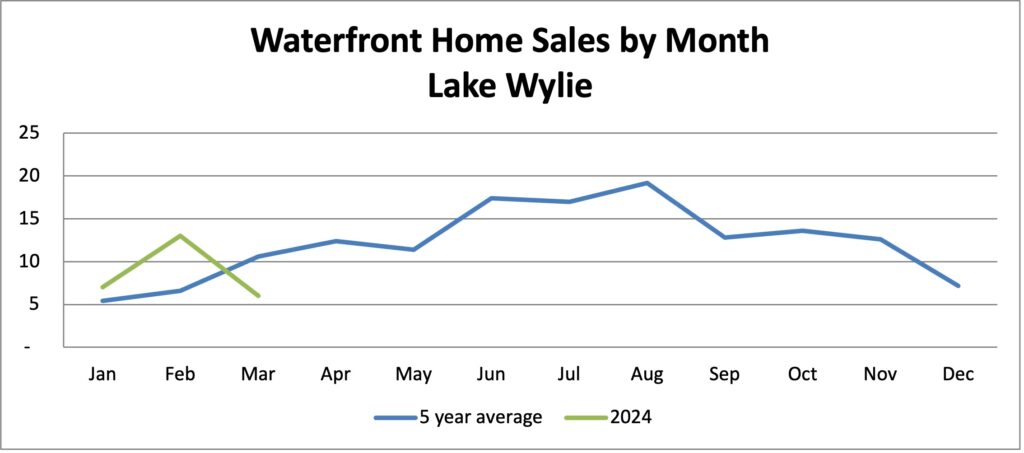
In the chart above, the blue line represents the average number of dockable waterfront homes sold each month during the past five years, and the green line represents this year’s sales. January and February sales this year were stronger than average, but March sales fell behind.


Typically, the first quarter of the year represents just 15% of annual sales, and the lowest number of listings available. Inventory and sales usually tend to pick up in early spring, leading into the primary sales season in warmer months.


At the end of March 2024, only 10 waterfront homes were under contract. Last year at the same time, there were 18, and the year before, 27. Thus it is reasonable to expect 2024 sales during April and May to fall well below average.


In the general market, non-waterfront home sales during first quarter dropped about 6% compared to the previous year, with a corresponding decline in inventory available.


Prices continue to rise


Home prices continue to rise, both on and off the lake. In the Lake Wylie area, the average price of non-waterfront homes is just under $500,000, an 11% increase from last year. Waterfront home prices have reached an average of over $1.3 million. For comparably sized homes, the waterfront premium is about $600,000 — which means a buyer should expect to pay an average of $600,000 more for a home on the water, compared to a similarly styled/sized home that is not waterfront.  While that figure will vary depending on the quality of home and the lot (size, view, location), it can provide a benchmark for a buyer to budget and set expectations.


Pre-pandemic, the waterfront premium was approximately $250,000, more attainable for buyer entry into the waterfront market. With rising real estate prices market-wide, however, most sellers are realizing significant profits when they sell their existing homes.


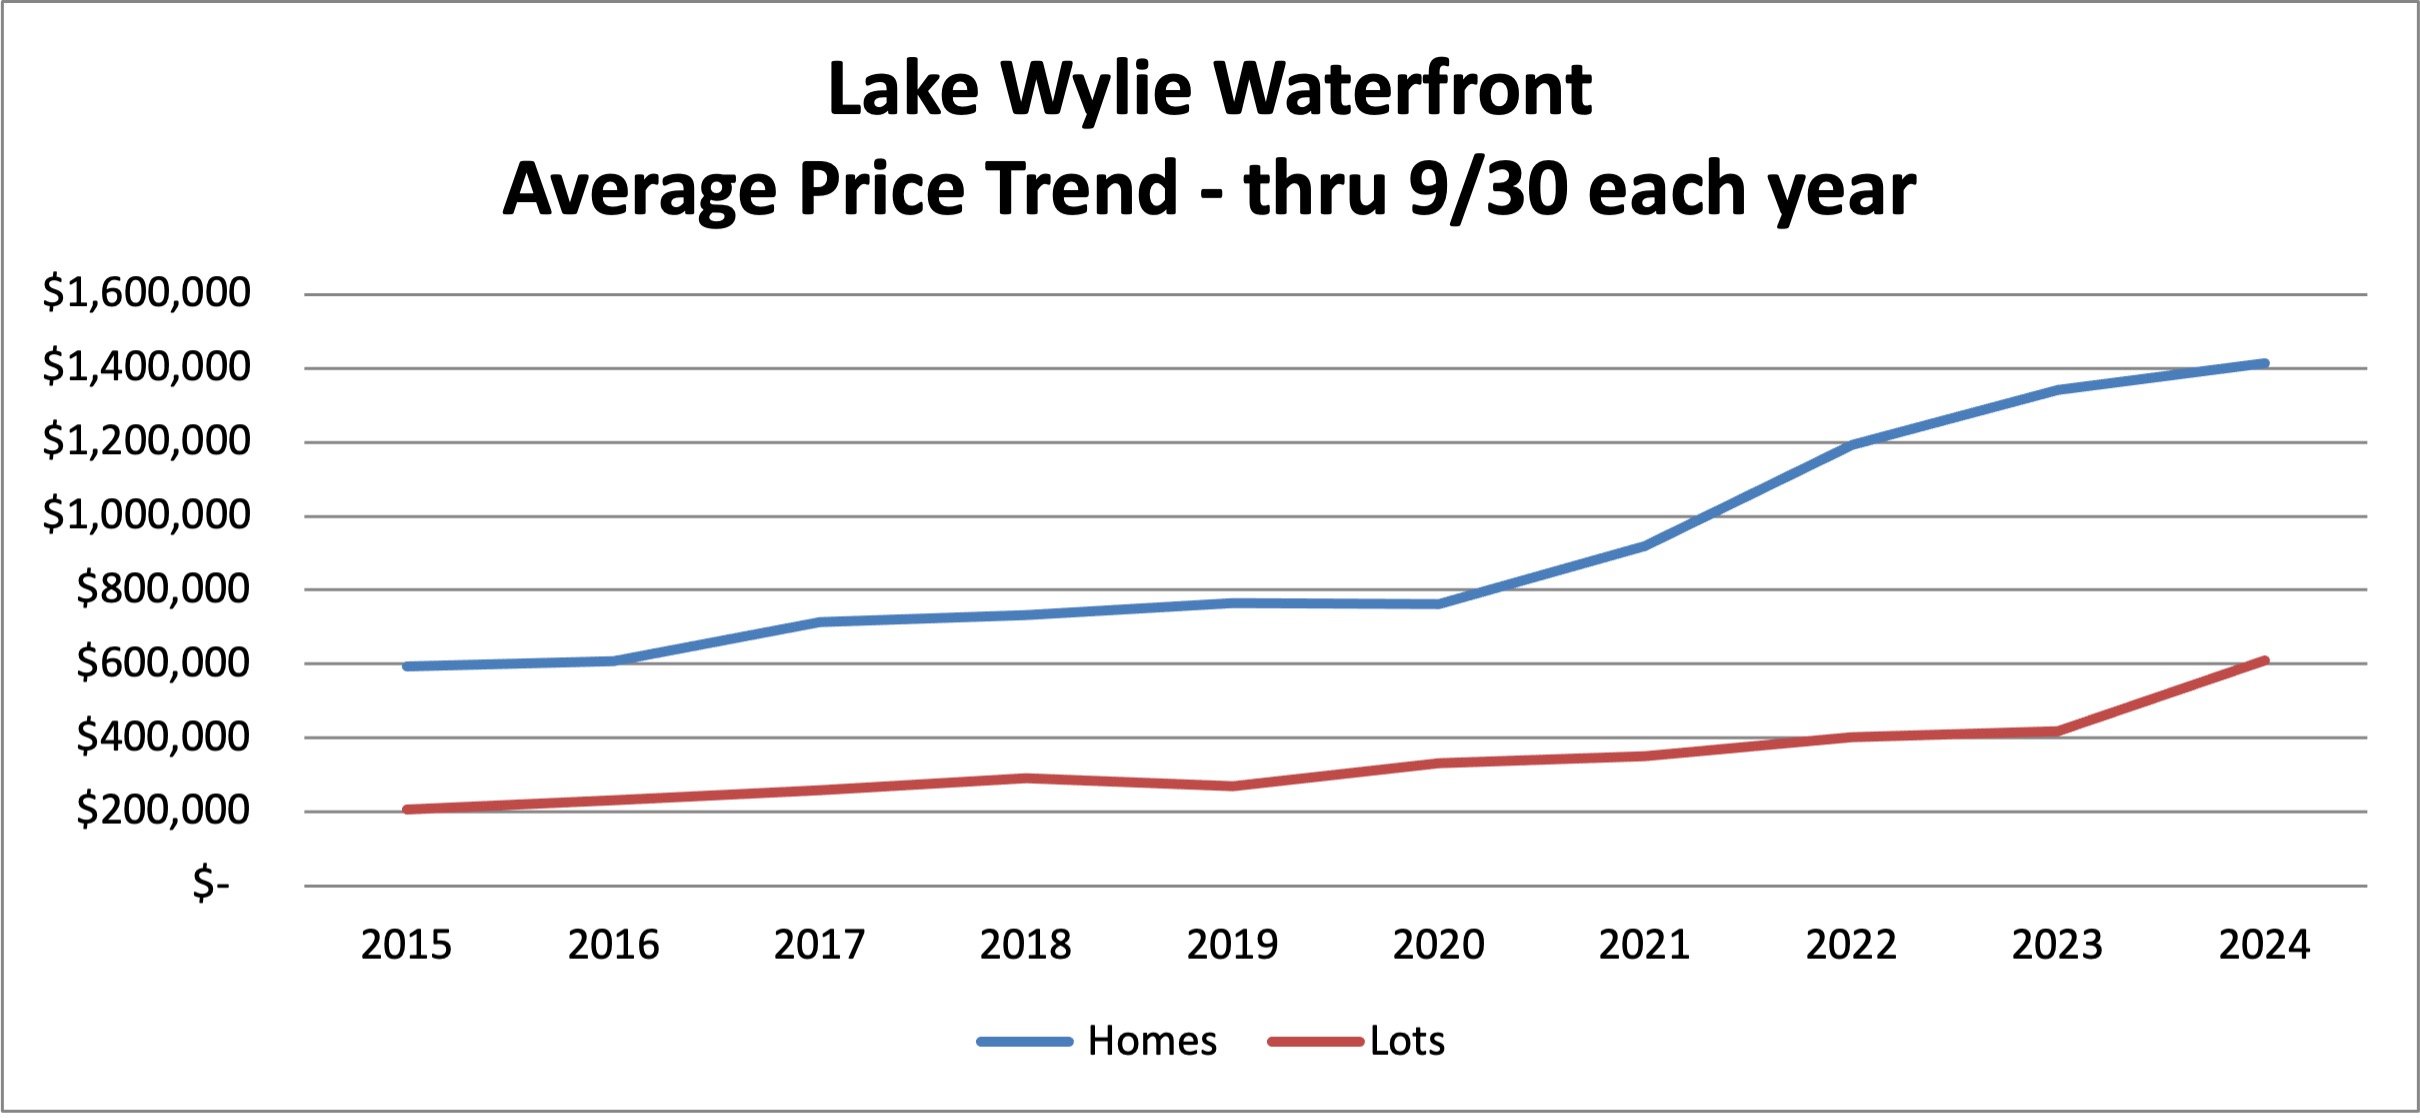
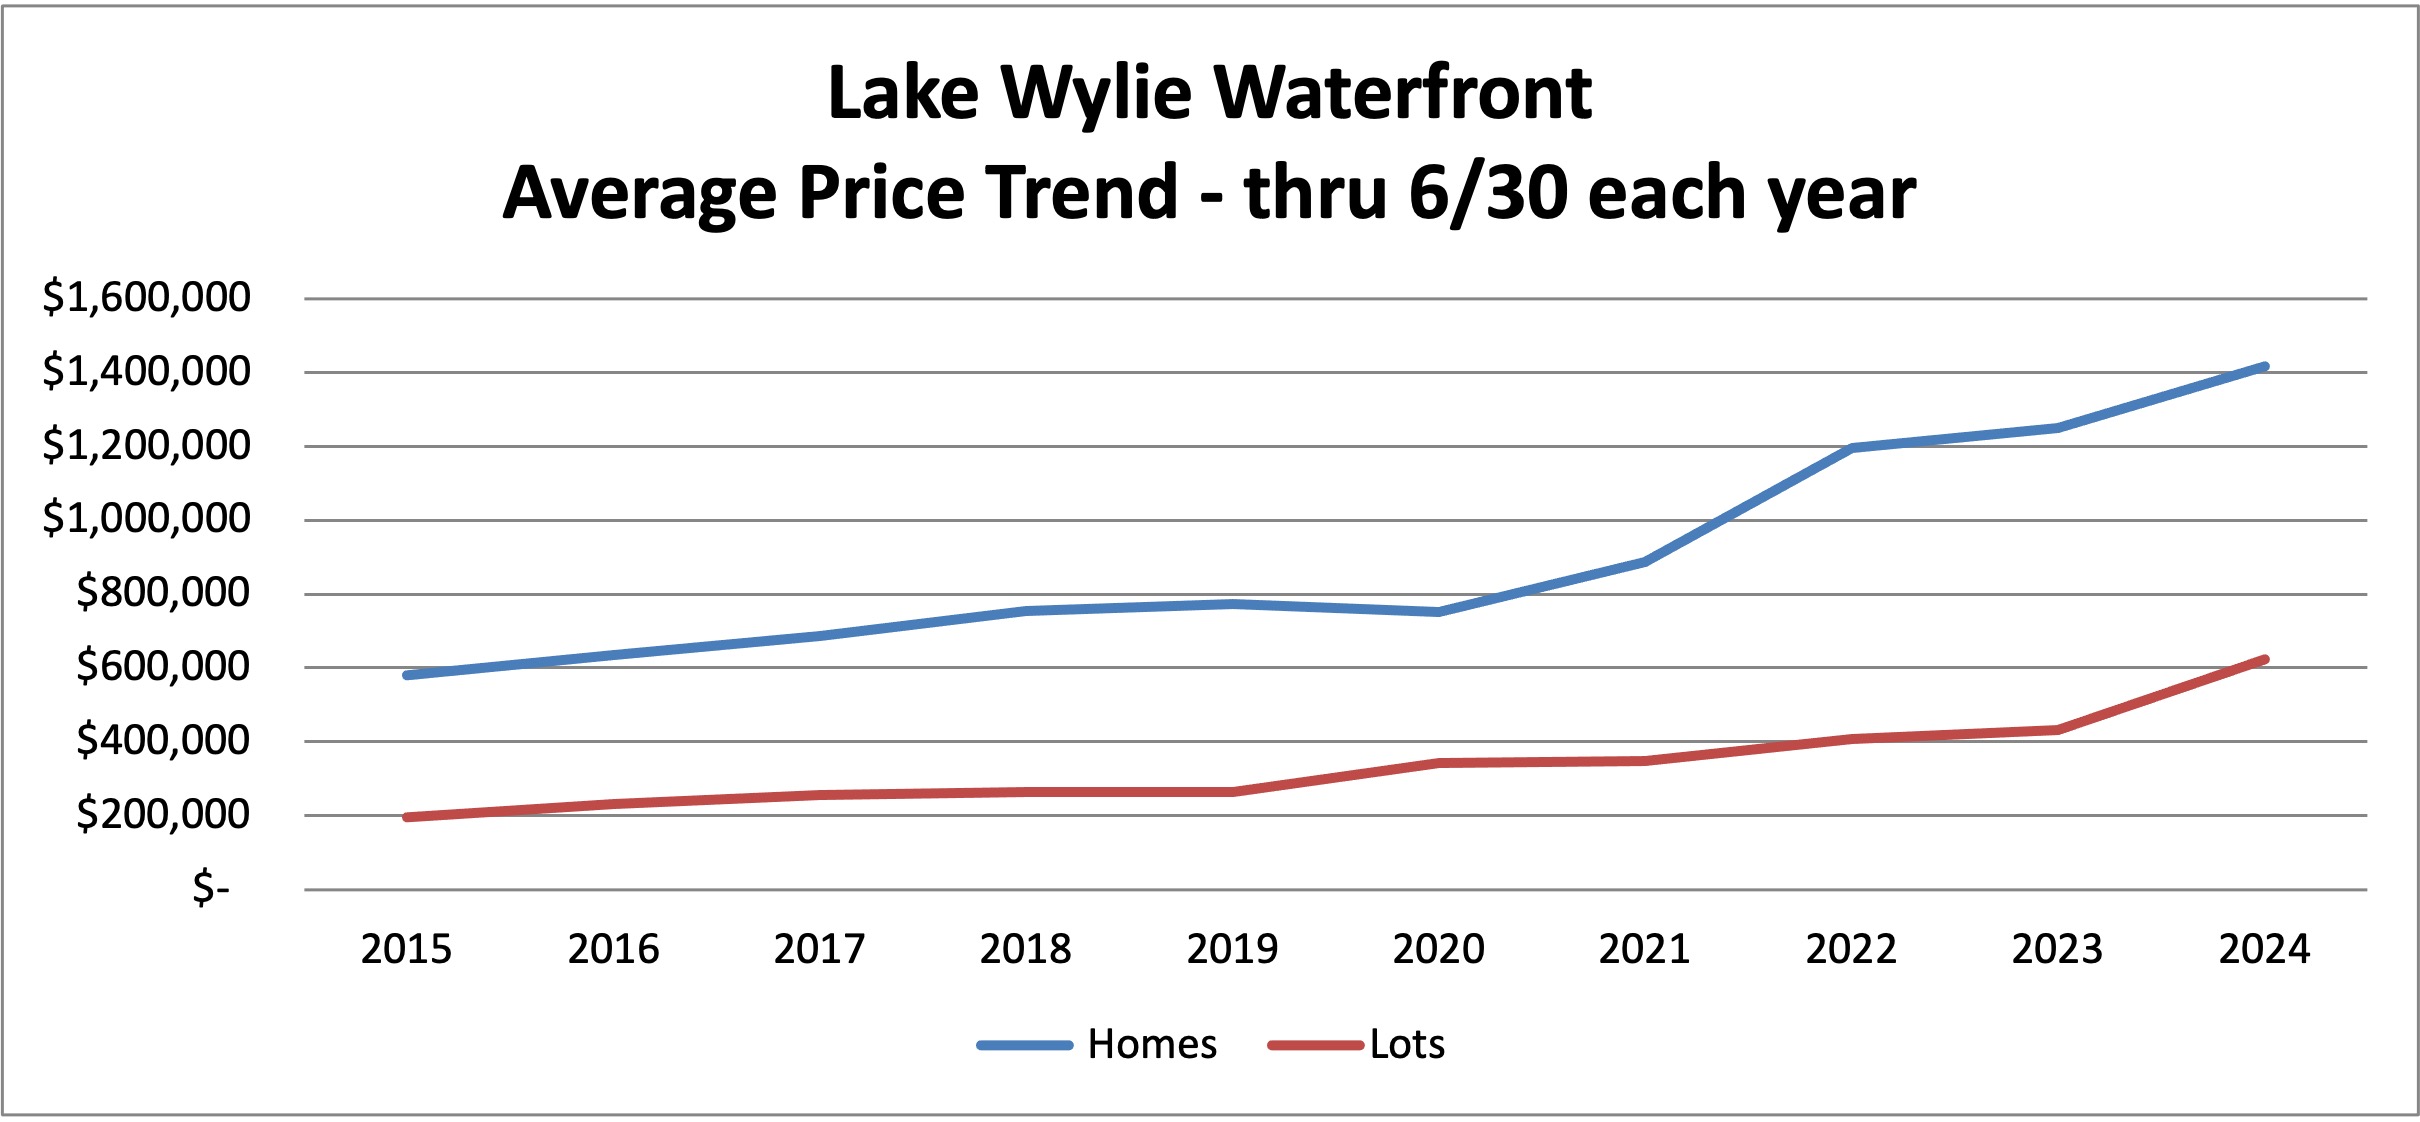
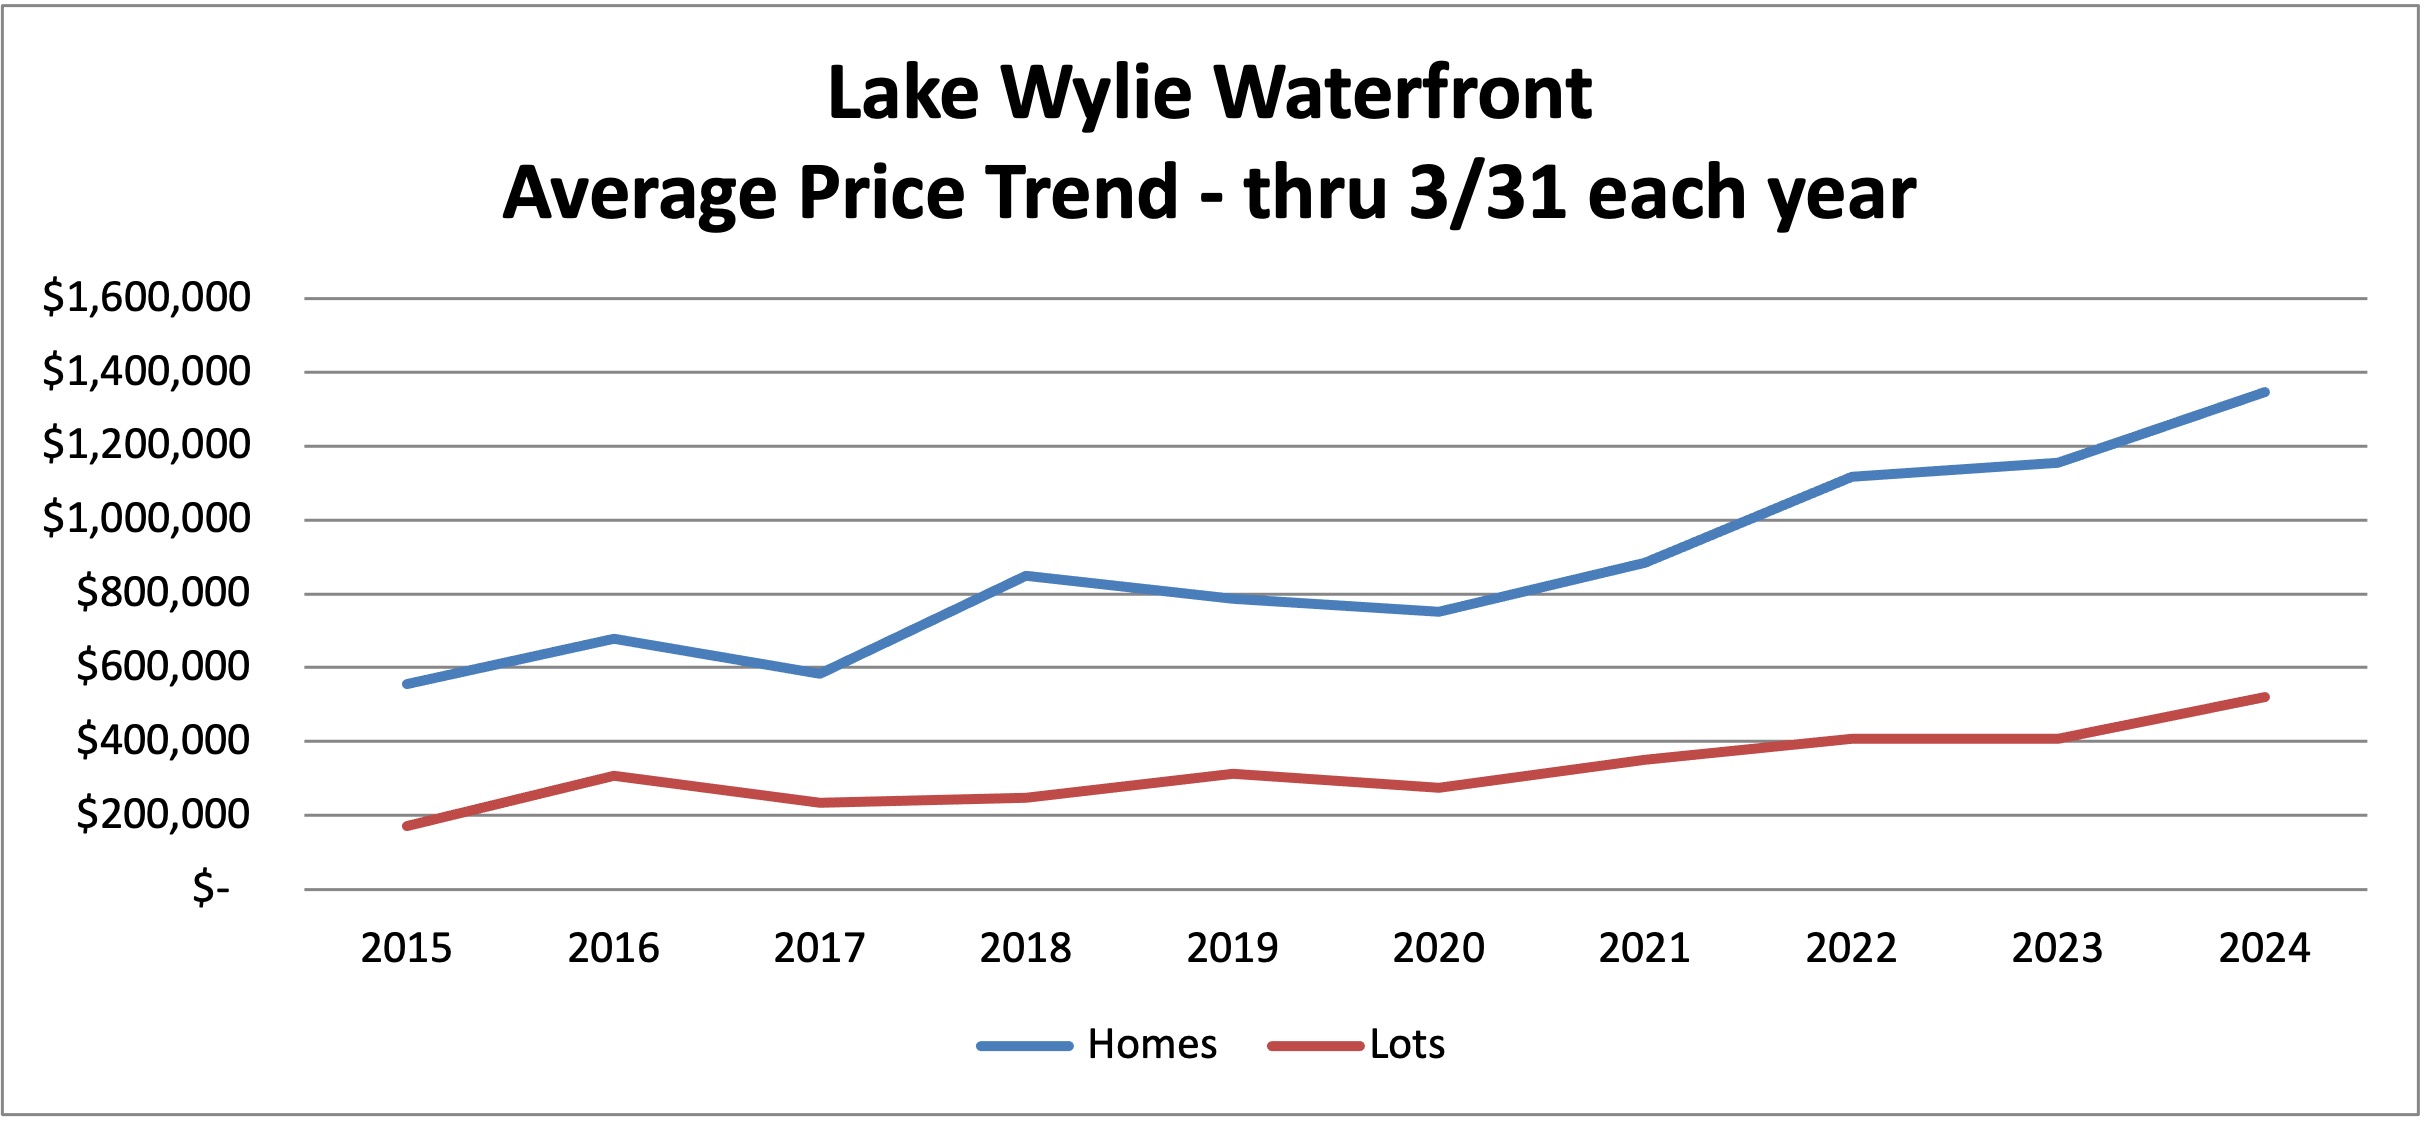
First quarter prices for dockable waterfront property is up considerably for both homes and land: 

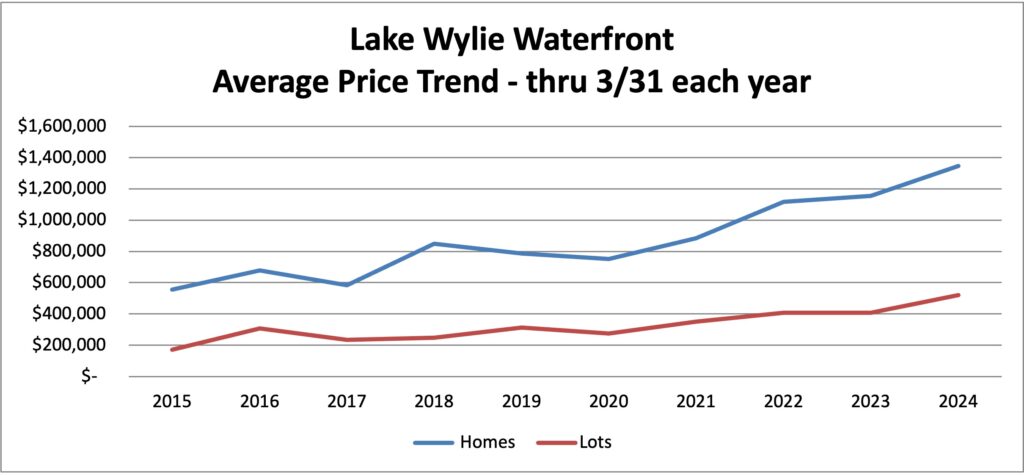
In the chart above, the red line represents the average price for dockable waterfront lot prices, and the blue line represents waterfront home prices. Waterfront homes on Lake Wylie averaged $1,350,000 in first quarter 2024, up 2% from last year. Lot prices rose more dramatically, to $520,000 in first quarter. It should be noted that about half of the lots sold were in the premium-priced McLean developments in Belmont, where the average price was over $700,000 for lots sized up to one acre.


To view details of waterfront sales in recent months, please visit my webpages, Recent Waterfront Home Sales and Recent Waterfront Lot Sales. If you have questions or wish to discuss your property, please give me a call. I look forward to hearing from you!


Drew


Spring into Lake Wylie Real Estate

Spring is on the horizon and I’m starting to see folks get out and enjoy the lake — which means that calls from potential buyers will start to pick up as people ride by “for sale” signs along the shorelines.


We’re barely into the year and already there are some surprises. For one, the market had 13 waterfront home closings on Lake Wylie in February. We’ve been tracking and analyzing Lake Wylie sales data for 17 years and have never seen that many properties sold this early in the year. Most were standard closings, using conventional mortgages with closing periods from 6-8 weeks in duration. A few were “quick” closes — three weeks or less, with cash terms. Some buyers, particularly those in a competitive bidding situation, offer the seller quick close dates to give themselves an advantage when the seller is considering multiple offers.


At a glance, 2024 sales to date on Lake Wylie:

Off the water, home sales in the area have been about the same compared to last year, with prices holding steady. One significant change is the time on market, now averaging 47 days (about a week and a half longer than last year). We’ve seen similar trends on the lake, with the average time on market now stretching out to 51 days.


Prior to the pandemic, homes on Lake Wylie took an average of 16-20 weeks to sell, while homes off the lake took an average of 6-8. Now, homes sell much more quickly, both on and off the lake. Demand still outpaces supply — with buyers waiting in the wings, frequently checking for new listings.


Inventory remains tight. Five years ago, in 2019, there were 92 waterfront homes and 88 waterfront lots listed on Lake Wylie. Half of the homes listed were priced under $800,000. Today, there are 37 waterfront homes listed — with 70% priced over $1 million — and only 31 lots.


The average asking price for waterfront lots currently listed is $725,000. Four of the highest priced lots are large acreage parcels (8-12 acres in The Sanctuary, plus a couple of large parcels off of Concord Road). McLean – South Shore is contributing to the high average with ten lots — all around three quarters of an acre in size — listed for $650,000 – $950,000, most of which are under contract. Depending on the area of the lake, premium waterfront properties offering wide views and convenient access are selling at prices never before seen on Lake Wylie.


If you’d like to take a look at more details for recent sales on Lake Wylie, visit my webpages Recent Waterfront Home Sales and Recent Waterfront Lot Sales. I’d be glad to help you determine the expected sales price for your own property, should you be considering a move. Just give me a call or shoot me an email.


In the meantime, enjoy spring!


Drew

What the Groundhog says about Lake Wylie real estate

Punxsutawney Phil indicated an early spring is on its way — which could mean a strong kickoff to the Lake Wylie real estate market!*
Right out of the gate, seven waterfront homes and two dockable lots closed on Lake Wylie. The homes ranged in price from $345,000 for a “fixer-upper” in Tega Cay to $3,000,000 for a luxury estate in Lake Wylie. January sales were higher in 2024 than in most years — but first-quarter sales aren’t usually a reliable indicator of the coming year.
Four properties sold could fall into the “cabin” category — older homes originally built as “weekenders”. These four averaged 54 years old, 1325 square feet, most with two bedrooms. The average selling price approached $700,000 — as each property either featured extensive renovations and updates or big views.
Prior to the mid-1970s, much of the land around Lake Wylie was leased, so those who leased the lots built simple cabins or installed mobile homes, since they did not own the land. After the land was released for sale, the long-term lessees were able to purchase at discount rates, and many retained the “cabins” and continued to use as summer retreats. Over the years, some of the cabins have been replaced by primary homes, some have been updated and renovated, and a few are close to their original state (in various stages of maintenance).
Quite a few of the remaining cabins are located on beautiful lots — as the land first offered for lease was often on or near a main channel of the lake. The land value has increased exponentially over the years. The trend of cabin sales and prices over the past few years is depicted on the graph below:
On the graph, the blue bar represents the number of cabin properties sold per year (axis on the left), and the red line indicates average price (axis on the right). In 2021 — a year when total Lake Wylie waterfront home sales was near its peak — 25 cabin properties sold for an average price of $530,000. In 2022, the number sold fell (primarily due to limited inventory) and the average price climbed to $750,000. In 2023, when inventory was even tighter, 9 cabins sold for an average of $685,000.
Bottom line — if the cabins are listed, they will sell. Demand is still high. Some buyers are purchasing for land value only, with intentions to remove the structure and build a primary home. Others are looking for small, move-in-ready lake retreats. The Lake Wylie Man can help you understand the value of this type property, which fluctuates based on future building potential (setbacks and restrictions), location and view, and current demand for various property types.
If you missed last month’s year end real round up, visit my website to see the 2023 Summary and Outlook, along with Recent Waterfront Home Sales and Recent Waterfront Lot Sales. Or give me a call and we’ll discuss the market and your property or particular needs. I look forward to hearing from you!
Drew
*There is no scientific evidence that Punxsutawney Phil knows anything about Lake Wylie real estate. However, you can consider The Lake Wylie Man a bonafide expert on the market. Each year for the past 15 years, The Lake Wylie Man has achieved the #1 spot in waterfront sales on Lake Wylie. With hundreds of properties sold on the lake that have produced almost every situation imaginable, our team can advise you like no other and help ensure a smooth closing and the best value for all.

The year in review: Lake Wylie Real Estate

Happy New Year, everyone! We’ve turned the calendar from a remarkable year in Lake Wylie real estate — and expect another challenging year to come in 2024. We’ve seen listing inventory continue to be very tight, prices continue to climb, and buyer demand continues to be strong — both on the lake and off.

Here is a quick glance at waterfront real estate performance in 2023:
Waterfront Sales Trends
We’ve been tracking sales for dockable waterfront homes and lots for sixteen years — “cleaning up” the data to eliminate occasional coding errors and making sure we’re looking at true waterfront properties. My team and I closely monitor prices, sales and influencing factors to help you understand the Lake Wylie real estate market like no one else can, as well as to hone our own expertise to ensure we’re giving you the best advice possible.
In the chart above, the blue bars represent the number of dockable waterfront homes sold on Lake Wylie each year, and the red bars represent waterfront lots.
In 2023, Lake Wylie waterfront sales totaled 89 homes (down 22% from 2022) and 18 dockable lots (down 59% from 2022).
Demand during the pandemic drove sales up for both homes and lots — but to a point where inventory was depleted. With prices on the rise and people spending more time at home, potential waterfront sellers who might have been on the move tended to stay put. As buyers snapped up the healthy level of listings that existed prior to 2020, there were fewer new listings by the day. By 2021, we were in a real struggle to find enough properties to meet buyer demand.
The average number of home listings at any given time on the market was as follows:
At any point in time on Lake Wylie in 2018, there were on average 104 waterfront homes and 95 waterfront lots listed for sale. (The number of listings was generally higher in the spring/summer/early fall months, and lower in the winter.)
In 2023, the average number of listings was under a third of levels prior to the pandemic. With very low supply, demand continued to outpace availability — resulting in higher prices and shorter time on the market. About 75% of waterfront home listings sold in under a month in 2023. Many were under contract within a day or two, at or above the asking price.
 
Waterfront price trends
Prices continued to climb in 2023. In the chart above, the red line represents average sales price for Lake Wylie waterfront homes ($1,325,000 in 2023). The blue line represents waterfront lots, and the green line represents area homes in the general market, based on the six zip code region that contains Lake Wylie.
Waterfront home prices spiked 10% in the past year and the average sales price is about 75% above the pre-pandemic average. Prices have risen sharply for individual homes, and the mix has shifted to higher priced, luxury home segments. Inventory levels have been tightest among the more moderately priced waterfront homes.
In the general market, prices have climbed to an average just over $500,000, up 3% from a year ago and up 50% compared to pre-pandemic prices. Ten years ago, the average price of a waterfront homes was about $350,000 above a non-waterfront home. Today, the average premium for a waterfront home is about $825,000.
Waterfront lot prices have risen as well, to just over $400,000 on average — up about 40% compared to pre-pandemic.
Looking at the distribution of waterfront home sales by price segment, several trends emerge:
In the chart above, the distribution of waterfront sales is shown by price segment, with dark blue bars representing homes priced under $500k, red bars representing homes priced $500-$699k, green $700-999k, purple $1mm-$2mm, and the teal bars homes over $2 million.
Sales of homes under the $500k price have dwindled from over 20% of the market to almost non-existent. Homes in that price range are small fixer-uppers at best, and unsalvageable in some cases (property is sold for land value.)
Just five years ago, homes priced under $700,000 represented over half the market. Now, less than 10% of sales are homes priced under $700,000. Recent sales in that price range are homes averaging 50+ years old and under 1,500 square feet. Some of these homes are “river cabins,” designed as weekend retreats.
Homes priced $700k up to $1 million have fallen in market share from about one-third of sales to about one-fifth of sales. These homes average 33 years old and 2,400 square feet. Five years ago, the same money could have purchased a 4,000 square foot home that was about 15 years newer. Examples of homes in this price segment include some of the smaller, older homes in Tega Cay; homes located in less convenient locations; and homes in coves with limited views.
The $1mm to $2mm price segment is the most dominant in today’s market, representing well over half of sales. A home between the prices of $1mm and $1.5mm averages about 3,500 square feet and is 26 years old — and the same home would have sold in the $700’s prior to the pandemic.
As the home price reaches $1.5-$2mm, more luxury features emerge — bigger views, nicer kitchens, more outdoor landscaping and living spaces. The average home in this price range is 17 years old and 4,400 square feet.
Over $2 million is the fastest growing segment, with just one sale in 2020 and ten sales in 2023. These homes are newer (averaging 13 years old) and larger (almost 5,900 square feet on average.) Most of the homes in this price segment have beautiful outdoor living spaces with covered porches, fireplaces, built-in grills, perhaps a pool. They have gourmet kitchens with high end appliances, possibly a wine cellar. Some have home theaters and second kitchens, luxury baths. They generally offer big, open views and some have sandy beach areas.
With such a rapidly changing market on Lake Wylie, we often need to educate potential buyers on what to expect in their price range. Several factors contribute to the price of waterfront property — including view, water depth and quality of the lakefront area, surrounding properties, county and neighborhood restrictions that determine use and development, lake and land location, and the quality, size and condition of the home.
If you’d like to see more details about recent property sales, please visit my webpages: Recent Waterfront Home Sales and Recent Waterfront Lot Sales.
The Lake Wylie Man team has once again achieved the most sales on Lake Wylie, outselling the next highest selling realtor by more than 4 to 1. Our expertise on the lake is unmatched, and we look forward to offering you a successful and profitable experience in selling your property. Thank you for your business, and all the best in 2024!
Drew

At a glance: Lake Wylie Real Estate

Happy November, everyone. As we head towards the holidays, I’m reminded how thankful I am for the client relationships we’ve built over the years. I never take for granted the trust you put into our team to guide you through big life decisions involving the sale or purchase of property. Thank you!

In October, nine waterfront homes and one dockable waterfront lot closed on Lake Wylie. Highlights at a glance are as follows:

The number of waterfront homes listed has ticked up just a bit to 41 — the highest we’ve seen since last November! Typically, inventory peaks in the summertime, but the market has fallen short all year in number of properties listed.

Tight inventory and high demand have yielded higher prices and frequent “bidding wars” on properties in high demand. Just over half of the waterfront homes sold this year have been at or above asking price!

In spite of rising interest rates, buyer demand has held strong for lake property. Sellers are realizing significant profits on the sale of their homes, and we expect that to continue.

With tight inventory driving market conditions, we’ve seen lower than average sales for this year, in almost every month:


In the chart above, the blue line represents the average number of Lake Wylie waterfront homes closed by month over the past five years. The green line represents this year.

Overall, sales are down about 20% in comparison to last year through October.

Homes currently on the market skew toward the higher priced properties, with the average price at $1.7 million. The average price for waterfront homes sold year-to-date is just over $1.3 million.

You can take a look at more details about recent properties sold on my webpages Recent Waterfront Home Sales and Recent Waterfront Lot Sales.

If you have questions or would like to discuss your property, please give me a call. I look forward to speaking with you!


Drew

Waterfront sales heat up in August!

Like our weather, real estate sales heated up big time in August with the largest number of waterfront closings to date this year. On Lake Wylie, 16 waterfront homes sold, at an average price of $1.3 million. Three dockable lots closed for an average price of just over $400,000.

Still, real estate performance is lagging significantly behind last year. At a glance:
Mortgage rates are north of 7% — a full percentage point above last year — keeping some buyers on the sidelines for the moment.
In the greater Charlotte market, the number of single family home sales are down 20% from year ago, and average prices are up about 4%. Nationwide, though, signs point toward home prices cooling down a bit.
In the Charlotte area and on Lake Wylie, we are still in a seller’s market. In August, 60% of the homes in the greater Charlotte market sold at or above asking price. On Lake Wylie, half of the waterfront closings in August were at or above asking price, and those same homes were under contract the first week on the market.
In spite of a strong August, waterfront home sales on Lake Wylie are still well below the average for the past few years:
With the exception of March, monthly waterfront home sales have lagged behind the past five year average. The spike we usually see in May through July simply did not materialize. In addition to high mortgage rates, the main culprit behind the sluggish sales is the lack of listings.
There are only 33 waterfront homes on the market on Lake Wylie — and 15 of those are under contract. Only 29 lots are currently listed, with three under contract.
If you’d like to see more details about the homes and land sold this year, please visit my website pages Recent Waterfront Home Sales and Recent Waterfront Lot Sales. If you have any questions or would like to discuss your property, please give me a call.
Our team continues to lead the market in waterfront sales and expertise — #1 for well over a decade! In this fast-paced market, you’ll want the best on the lake — The Lake Wylie Man team — to advise you on pricing, marketing, and all of the special considerations of successfully selling waterfront real estate.

August update – Lake Wylie real estate

Summertime is coming to a close, and we’re seeing a small uptick in sales, with 21 waterfront homes and 7 dockable lots under contract — the highest we’ve seen all year.

However, sales activity is still much slower than “typical.” Usually, as we enter August, there are 35-40 homes under contract, and 10-15 lots. A lack of listings, rising mortgage rates, and rising prices both on and off the water have stifled sales all year. Here’s a quick glance at Lake Wylie waterfront real estate stats:

Sales in July ranged from a “cabin” on upper Lake Wylie for $685,000 to a large, 9,138 square foot home on River Oaks Road for $3.6 million. Buyers are ready to purchase homes at all price points on Lake Wylie, with about a third of the buyers paying cash (no financing.)
 
Prior to the pandemic, when interest rates were low, about 20% of waterfront buyers paid cash for their home purchases.
 
Typically, sales for Lake Wylie waterfront properties peak in summer months. This year has been an anomaly:
 
 
In the chart above, the blue line represents the average number of waterfront home closings by month over the past five years, and the green line represents 2023 closings by month. With the number of pending sales “in the hopper,” we expect to see a peak in August/September, though the numbers will be well below the 5-year average. 
 
The number of listings available still lags significantly behind demand. Properly priced homes and land are selling quickly, and buyers are still waiting in the wings. To see details on recent waterfront sales, please visit my webpages Recent Waterfront Home Sales and Recent Waterfront Lot Sales.
 
I’d love to talk to you about your property if you have any questions or are interested in a valuation. The Lake Wylie Man continues to lead the waterfront market on Lake Wylie, and no other Realtor in the area has as much experience selling Lake Wylie waterfront. I look forward to hearing from you!