As we enter the final quarter of 2021, we’re just over a year and a half into “pandemic real estate.” We’ve watched out market boom, with properties selling fast and high, in spite of record low listing inventory.
In September, both on and off the lake, sales began to slow, just a little. Whereas at the end of 2nd quarter, we were clipping along with waterfront home sales 22% above last year’s activity, we close third quarter at just 6% above last year’s sales.
Why the gentle touch on the brakes? Closings in September tie to sales contracts written in July – August, when COVID numbers began to rise again. Listing inventory dipped, resulting in fewer properties for buyers to buy. Finally, closings are taking a bit longer — with higher workloads for appraisers, inspectors, repair contractors, and closing attorneys. Plus, some sellers are negotiating longer closings in order to find their own new homes
On the lake, September closings fell below the 4-year average for the month:
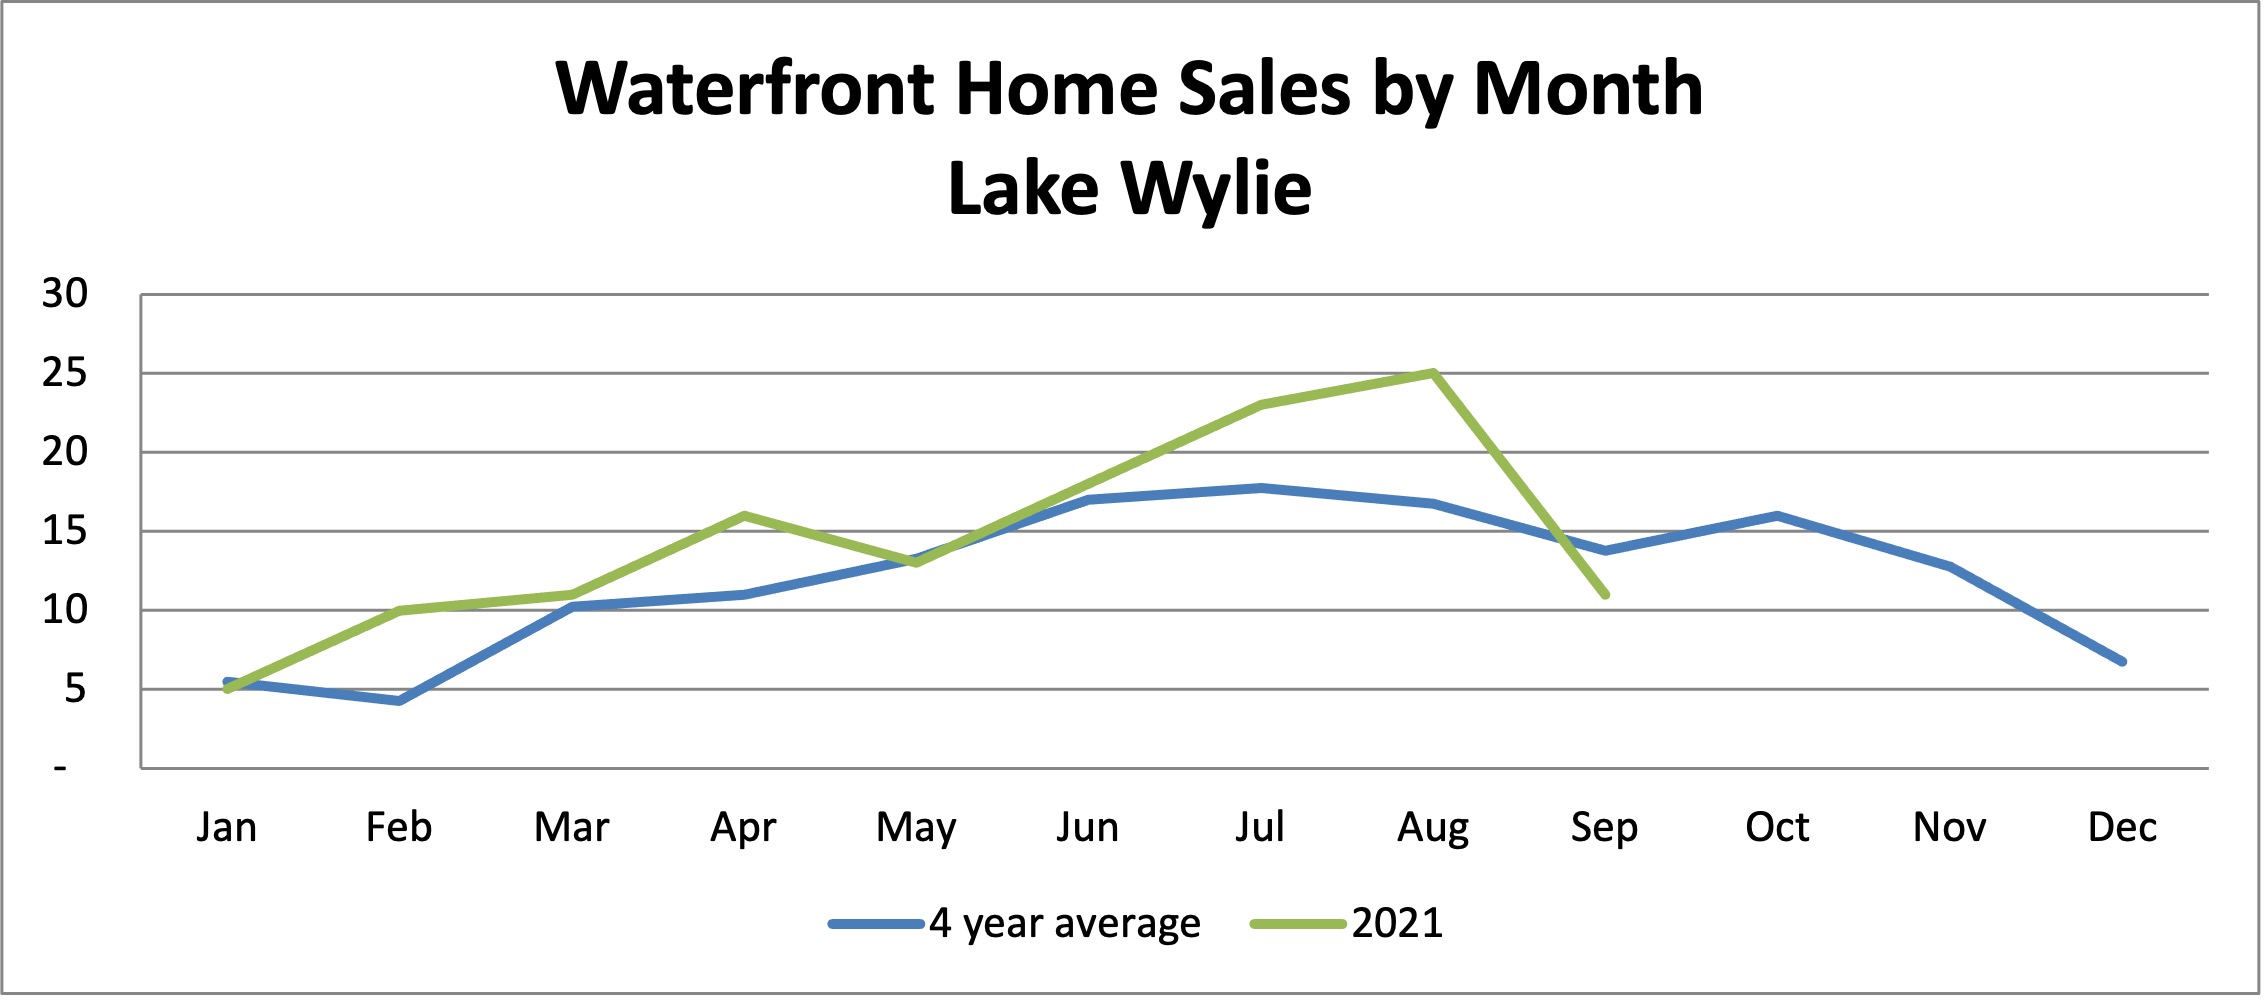
In the chart above, the green line represents the number of closings on Lake Wylie waterfront homes by month, and the blue line represents the 4-year average from 2017-2020. Up until September, this year’s activity was at or above the average each month.
Waterfront sales trends
Year-to-date, the number of waterfront home sales on Lake Wylie is up 6% in comparison to last year. Waterfront lot sales are up 61%. The sales trend for the past decade:
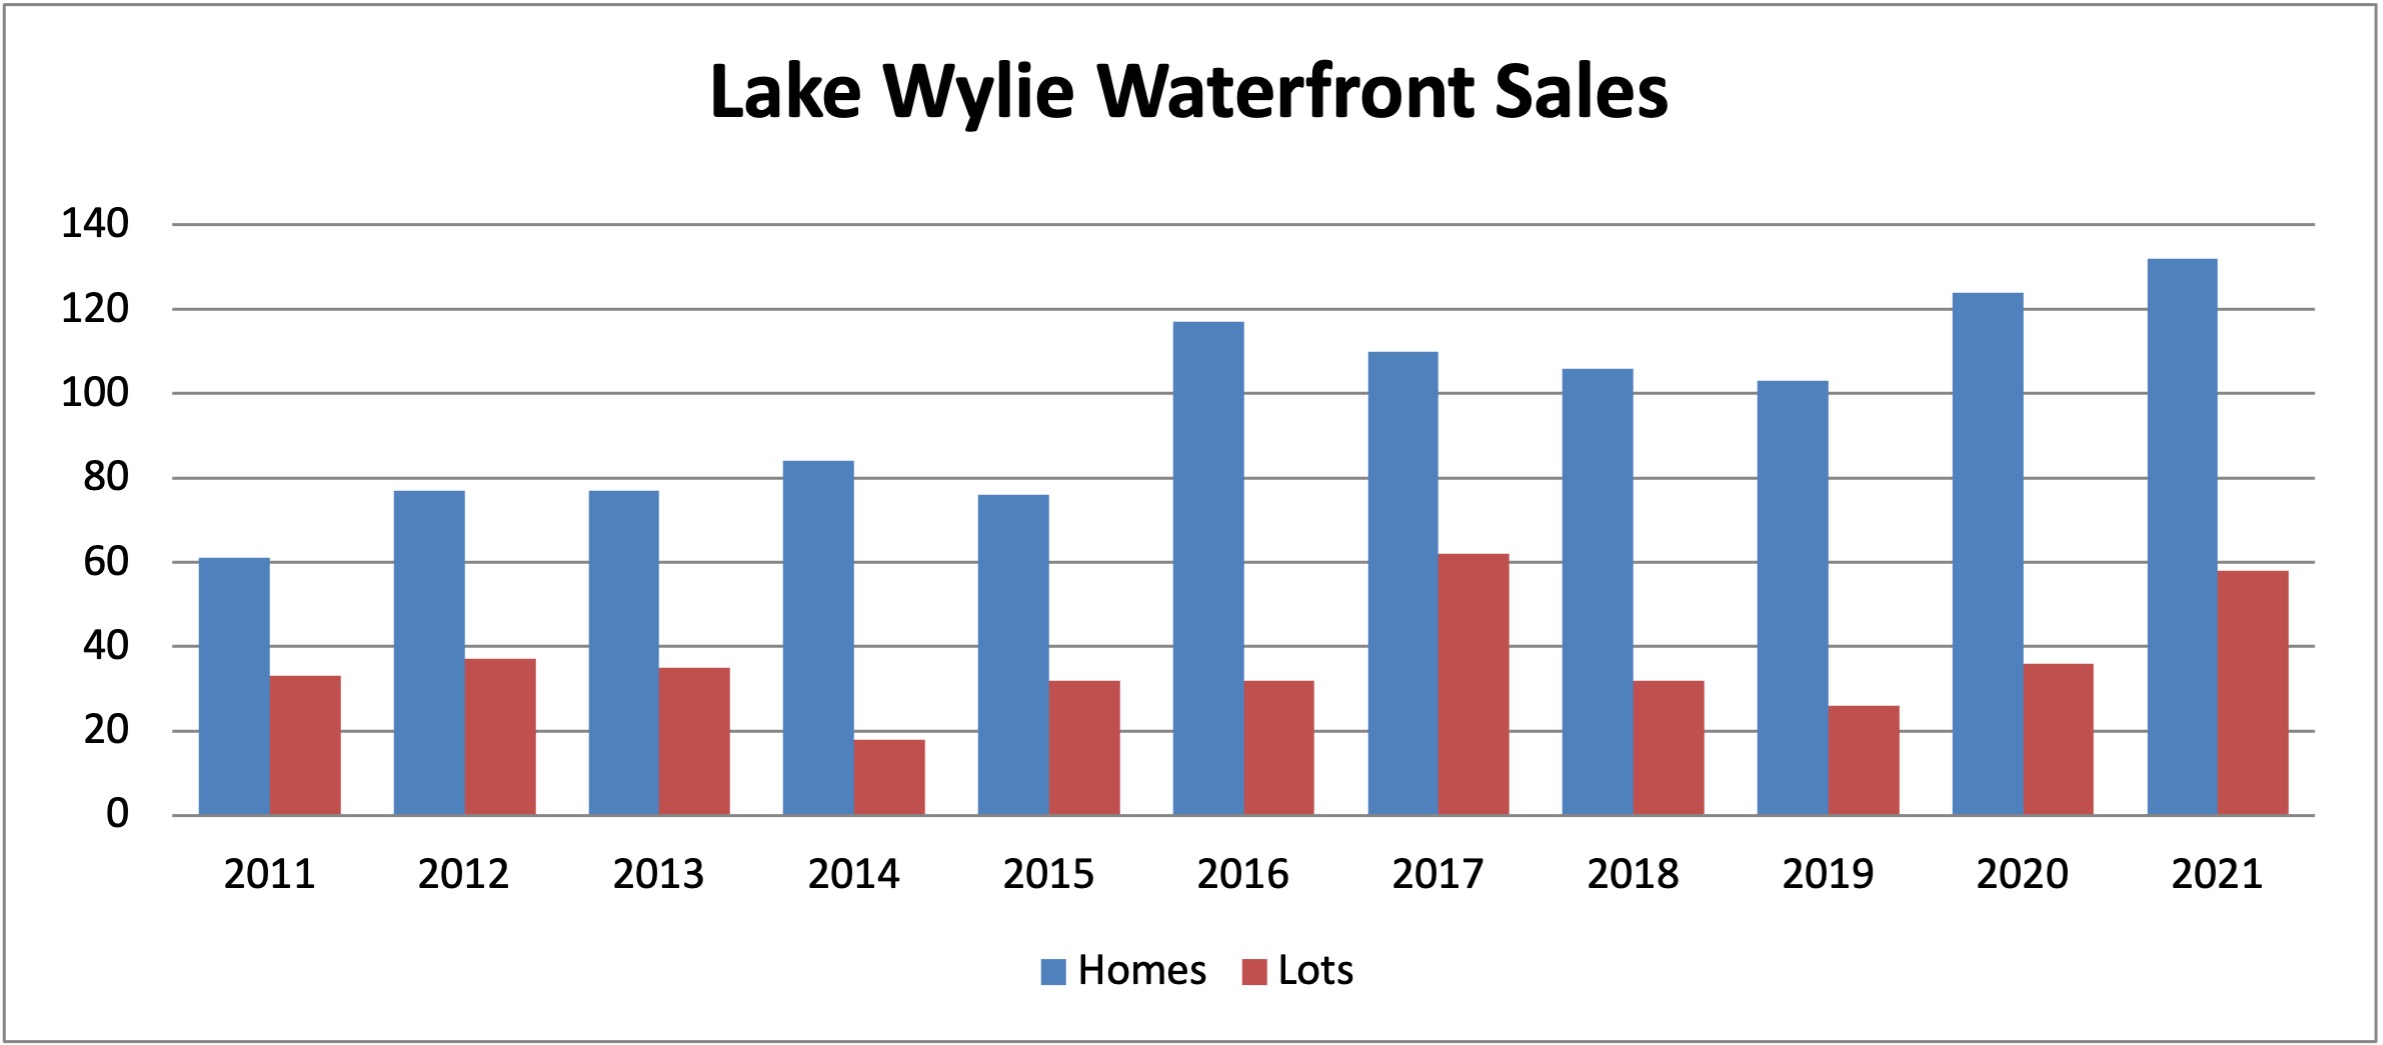
In the chart above, the blue bars represent the number of waterfront homes sold on Lake Wylie through the end of 3rd quarter each year. The red bars represent dockable lot sales.
Beginning in 2016, waterfront home sales popped up to record levels on Lake Wylie, with new developments being built on the lake and an influx of population — buyers with deeper pockets to purchase luxury lake homes.
Waterfront lot sales tend to vary a bit more year-to-year. The introduction of McLean developments in Belmont brought premium lots on the market, increasing sales and prices in the past couple of years.
Waterfront price trends

In the chart above, the red line represents the average price of waterfront homes on Lake Wylie, and the blue line represents lot prices. After a plateau in the first half of the decade, prices began to sharply increase in 2017 and again in the past year.
The average waterfront lot price is now $350,000, up 5% from last year and up 30% from pre-pandemic. Thus far in 2021, eleven lots have closed in McLean for prices in the mid $300’s and up, plus six lots in the Sanctuary (averaging in the $500’s).
The average waterfront home has reached $920,000 — an all-time high. Year-to-date, 45 homes have close at over $1 million, about 34% of total home sales on the lake. Last year, we reached an all-time high of 25% of home sales in this luxury price range.
Not only are sales shifting to higher-priced properties, but prices have increased across the board. Price per square foot is up 35% above pre-pandemic (2019) prices for waterfront homes on Lake Wylie, and up 26% for non-waterfront homes in our area.
Listing inventory
For waterfront homes, listings usually peak in June-August, then taper off as we approach the end of the year. A three-year trend shows typical peaks and valleys in listings:
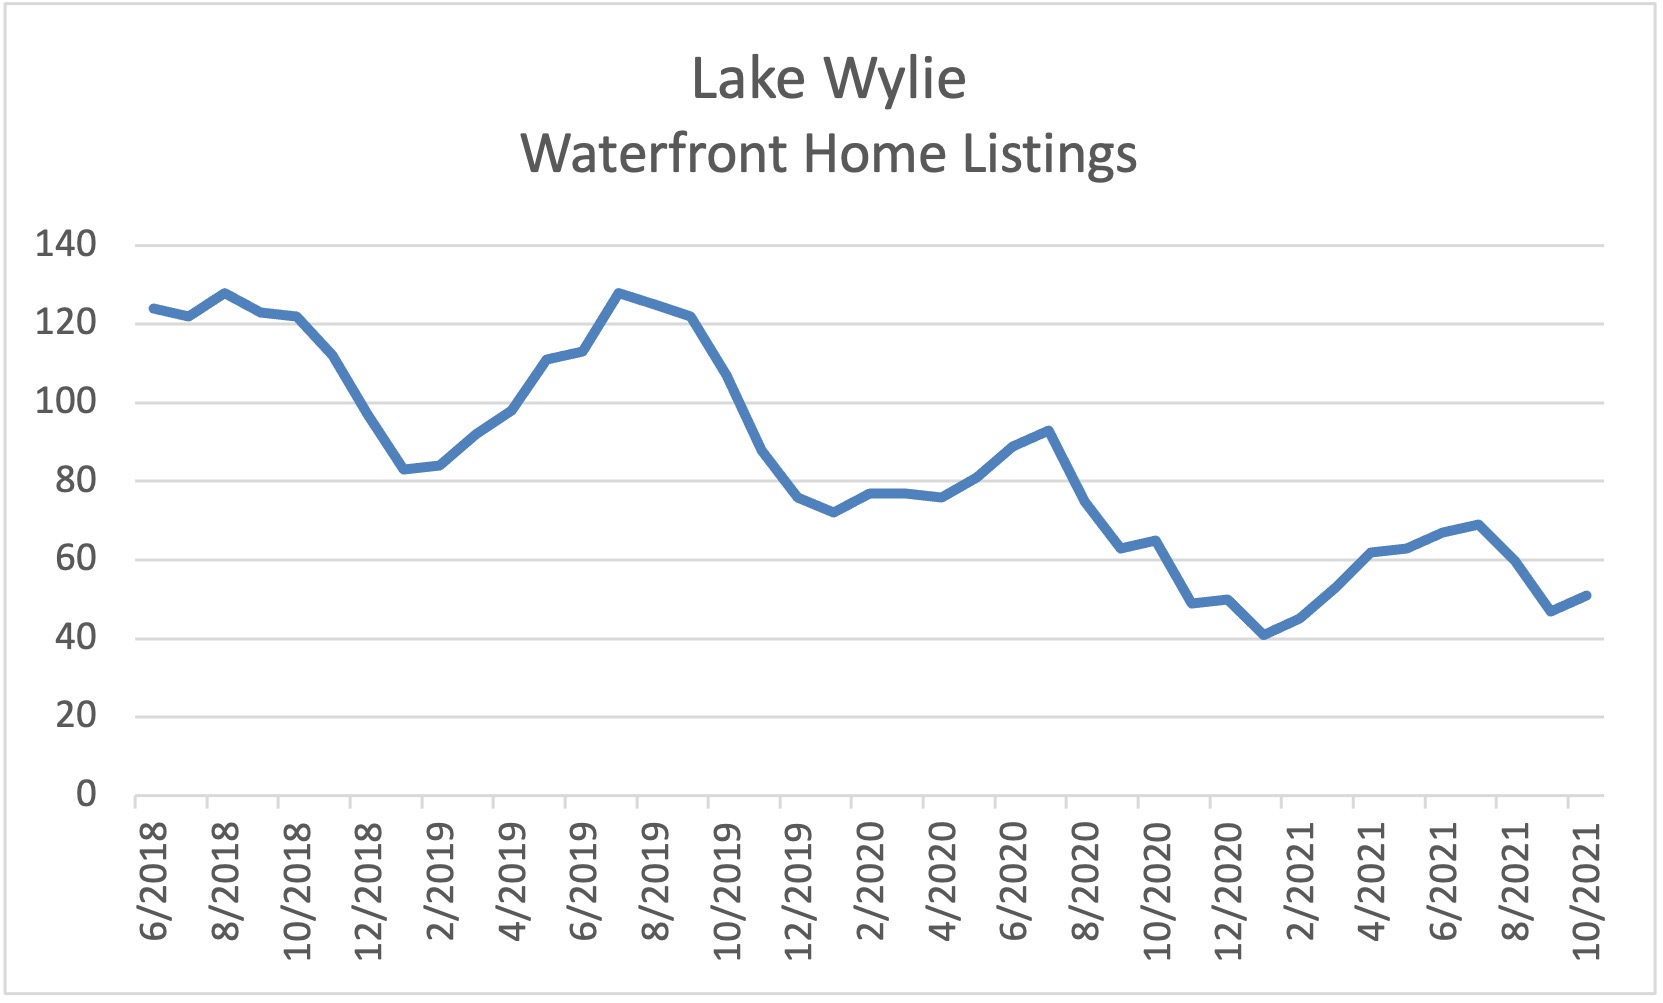
The chart above shows the number of active listings (including properties under contract) for waterfront homes on Lake Wylie over the past few years. Listings generally top out in summer and reach their low point in December/January.
What is remarkable about this 3-year look is how the peak number of listings has dropped from 125 or so to 65. Yet even with the tightening of supply, the increase in demand has resulted in significant sales increases during this same time period. Average time on the market for waterfront homes is just 31 days — compared to 4 months or so in recent years.
The listing shortage has also contributed to price increases.
Waterfront lot listings are even more limited:
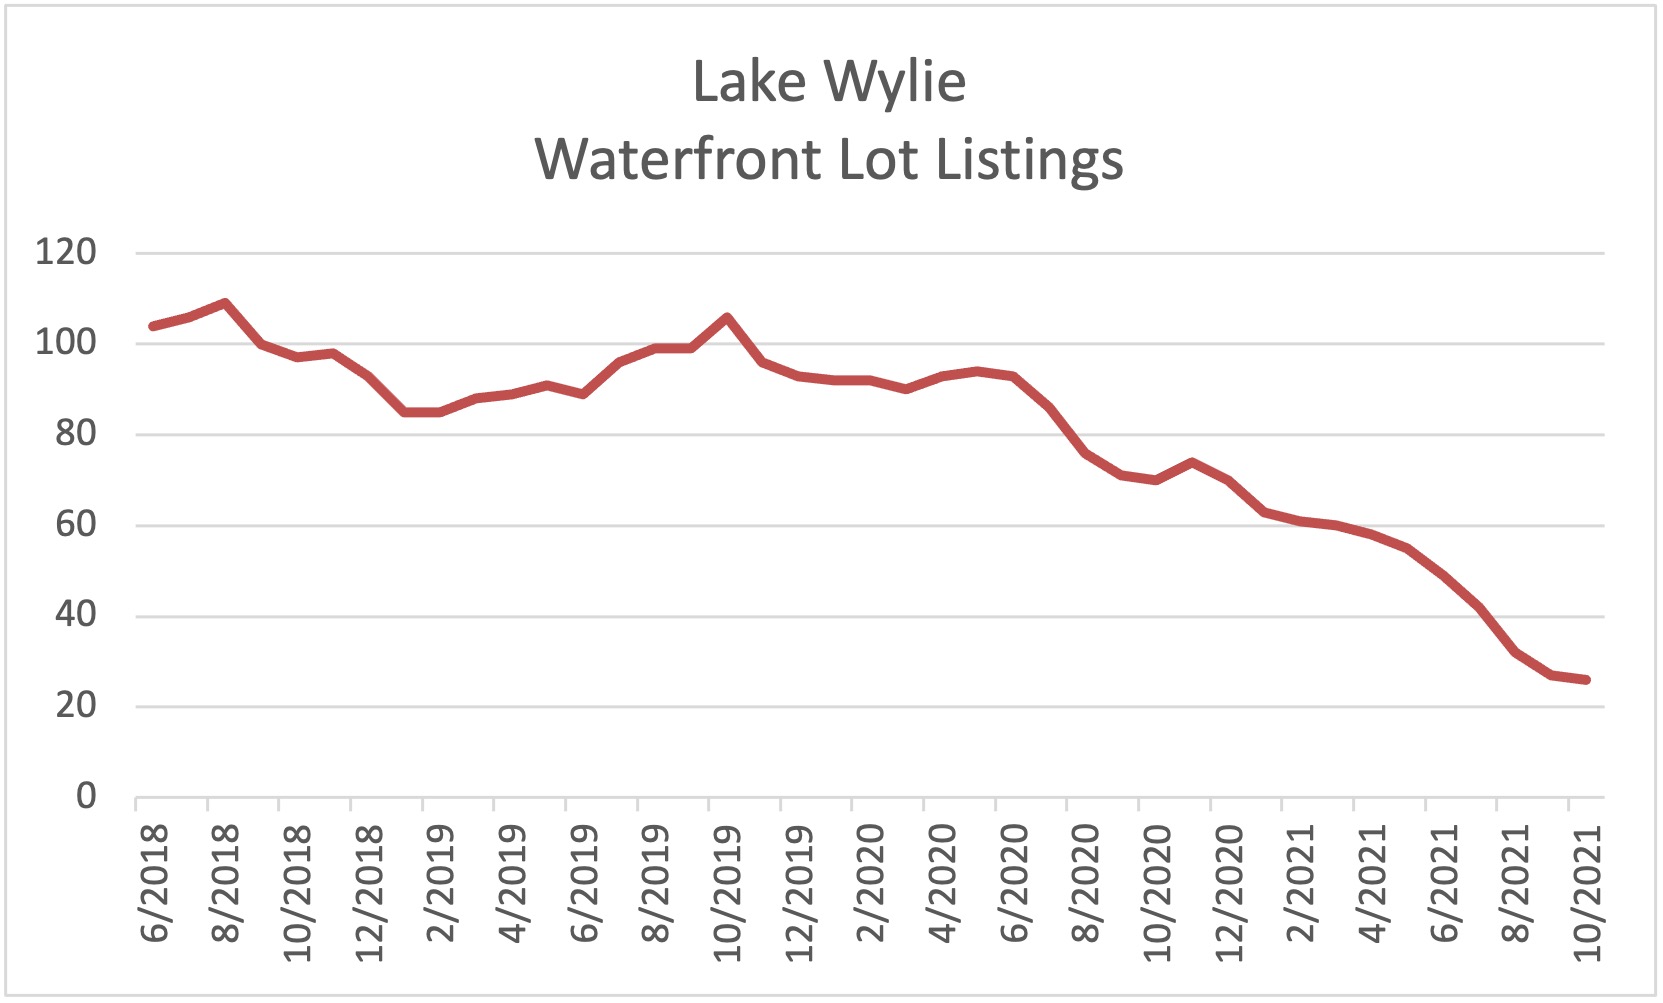
The chart above shows the number of dockable lots on the market from month to month. The peaks and valleys are not as pronounced seasonally as they are for homes — as the sale of raw land aren’t as dependent on buyers’ and sellers’ moving schedules (higher in the summertime.)
What is remarkable about the lot listing trend is the rapid decrease in the number of listings since last summer. At the beginning of the decade (not shown on this chart), there were about 200 lots listed. At the beginning of October 2021, there were just 26. Vacant land is rarer on the lake, as more land along the shorelines has been developed over the past few years.
If you’d like more detail on the sales behind these charts, visit my web pages Recent Waterfront Home Sales and Recent Waterfront Lot Sales.
Over the years, The Lake Wylie Man team has closed hundreds of waterfront properties, and we have unparalleled expertise on the lake. In this volatile market, it is important to rely on the #1 Realtor to advise you on the unique considerations for lake property and ensure a successful closing.
Thus far in 2021, we’ve completed 43 waterfront transactions — more than 3.5 times as many as the next highest-selling Realtor on Lake Wylie.