Greetings! We’re on the home stretch of 2024, and it seems we’ve entered a new era in real estate on Lake Wylie.
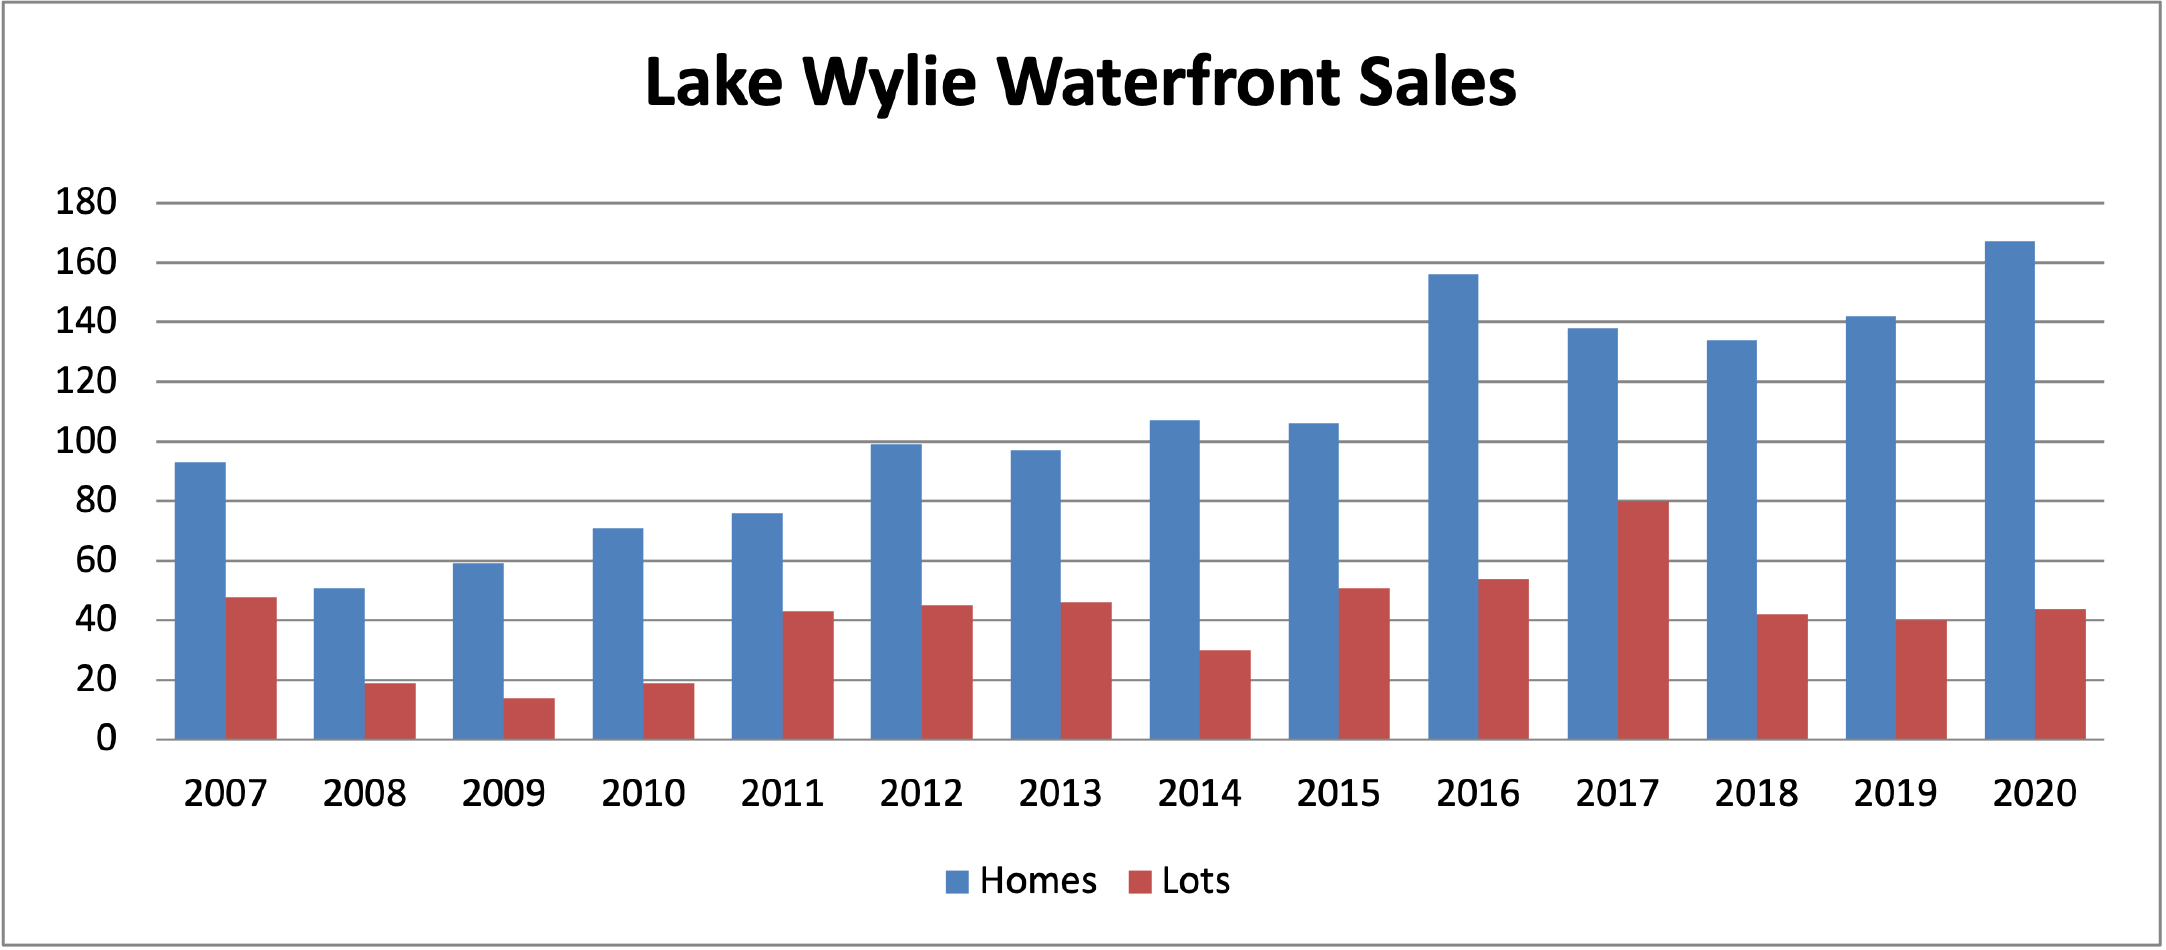
Just a few years ago, buyers had many waterfront properties to choose from, ranging from a wide selection of vacant lots, to “weekender” cabins, to modest family homes to luxury showplaces.
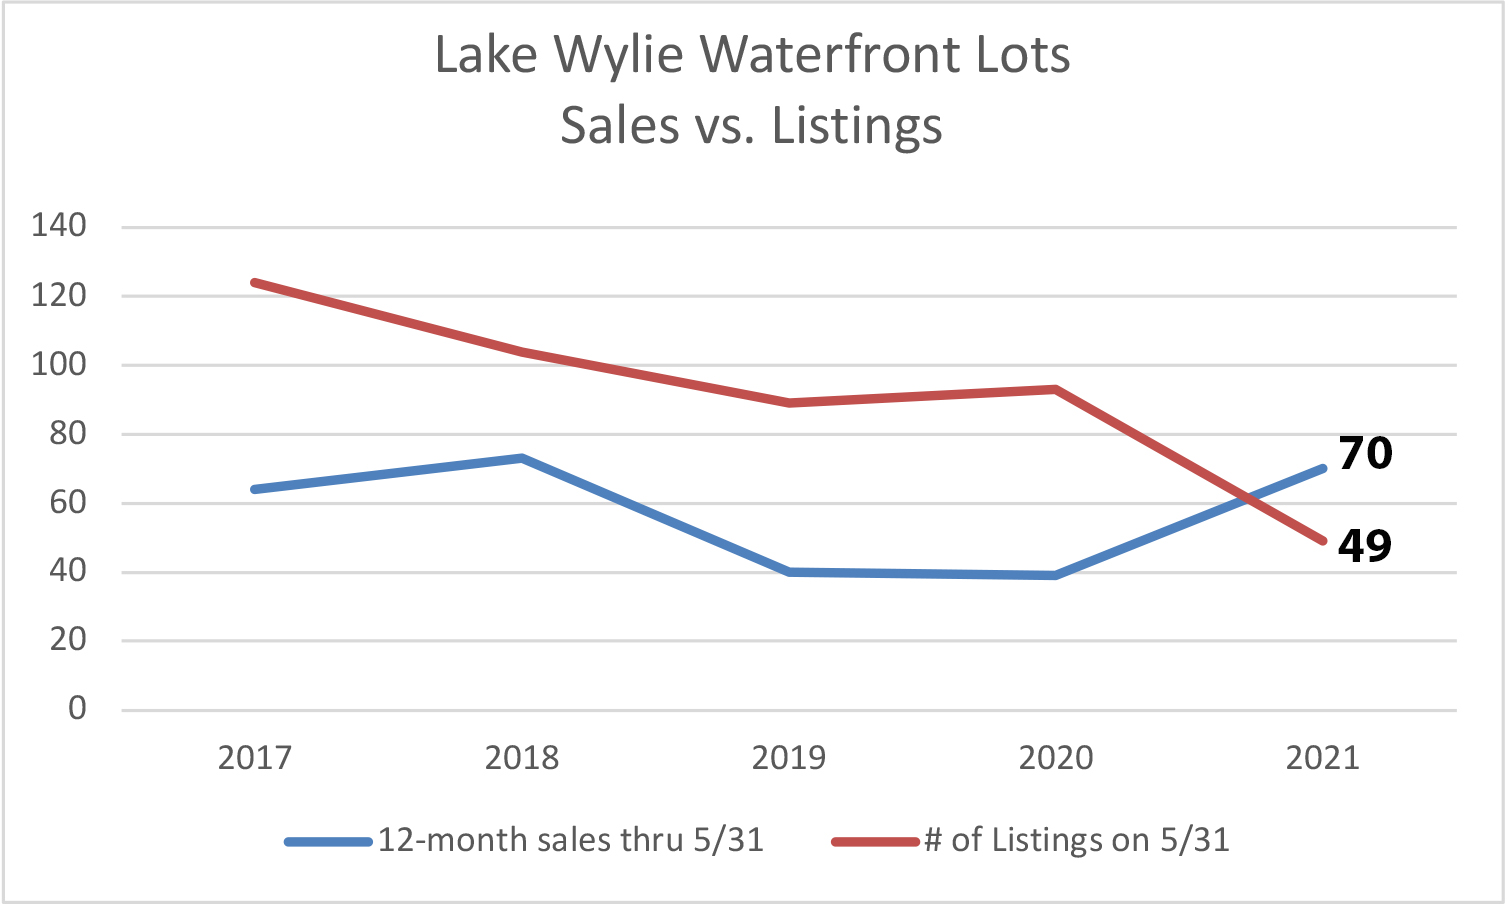
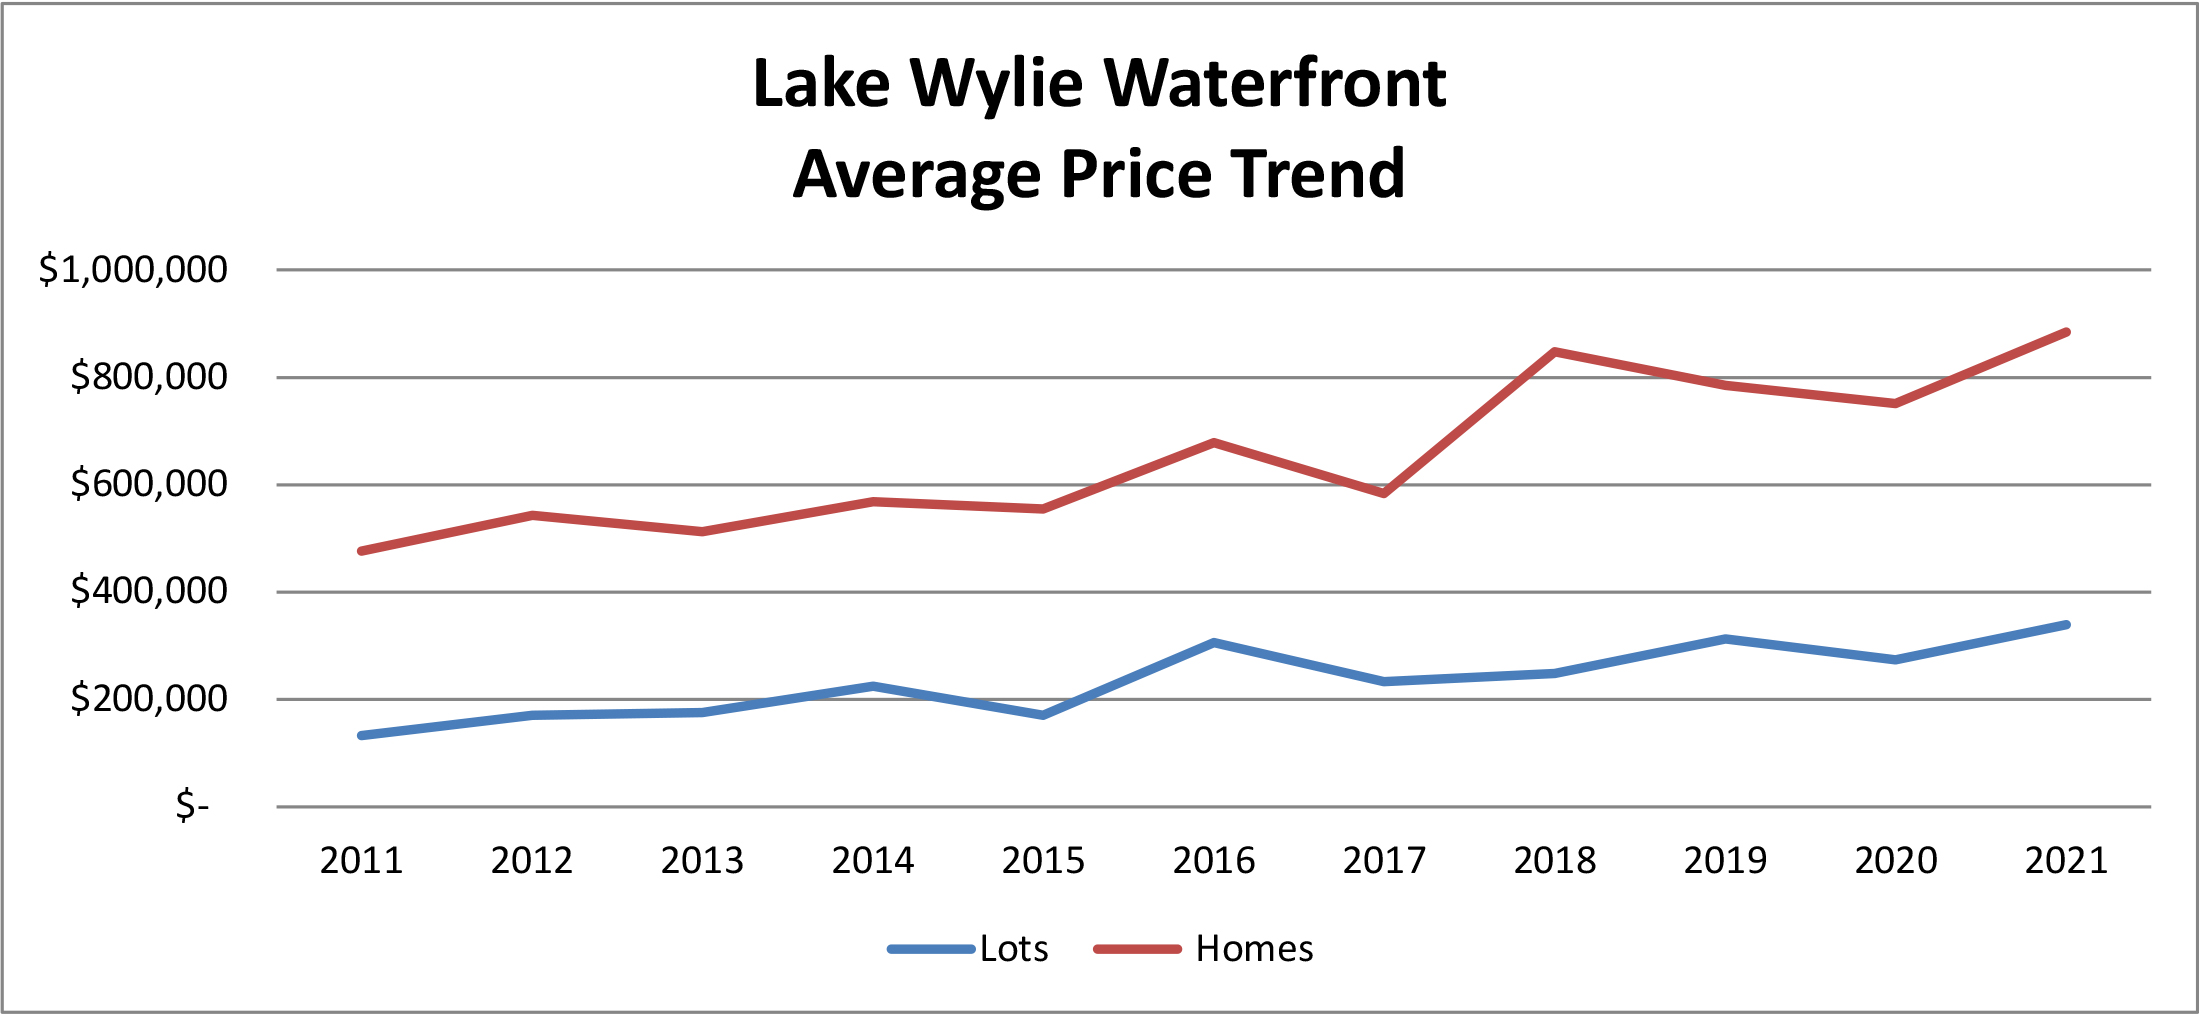
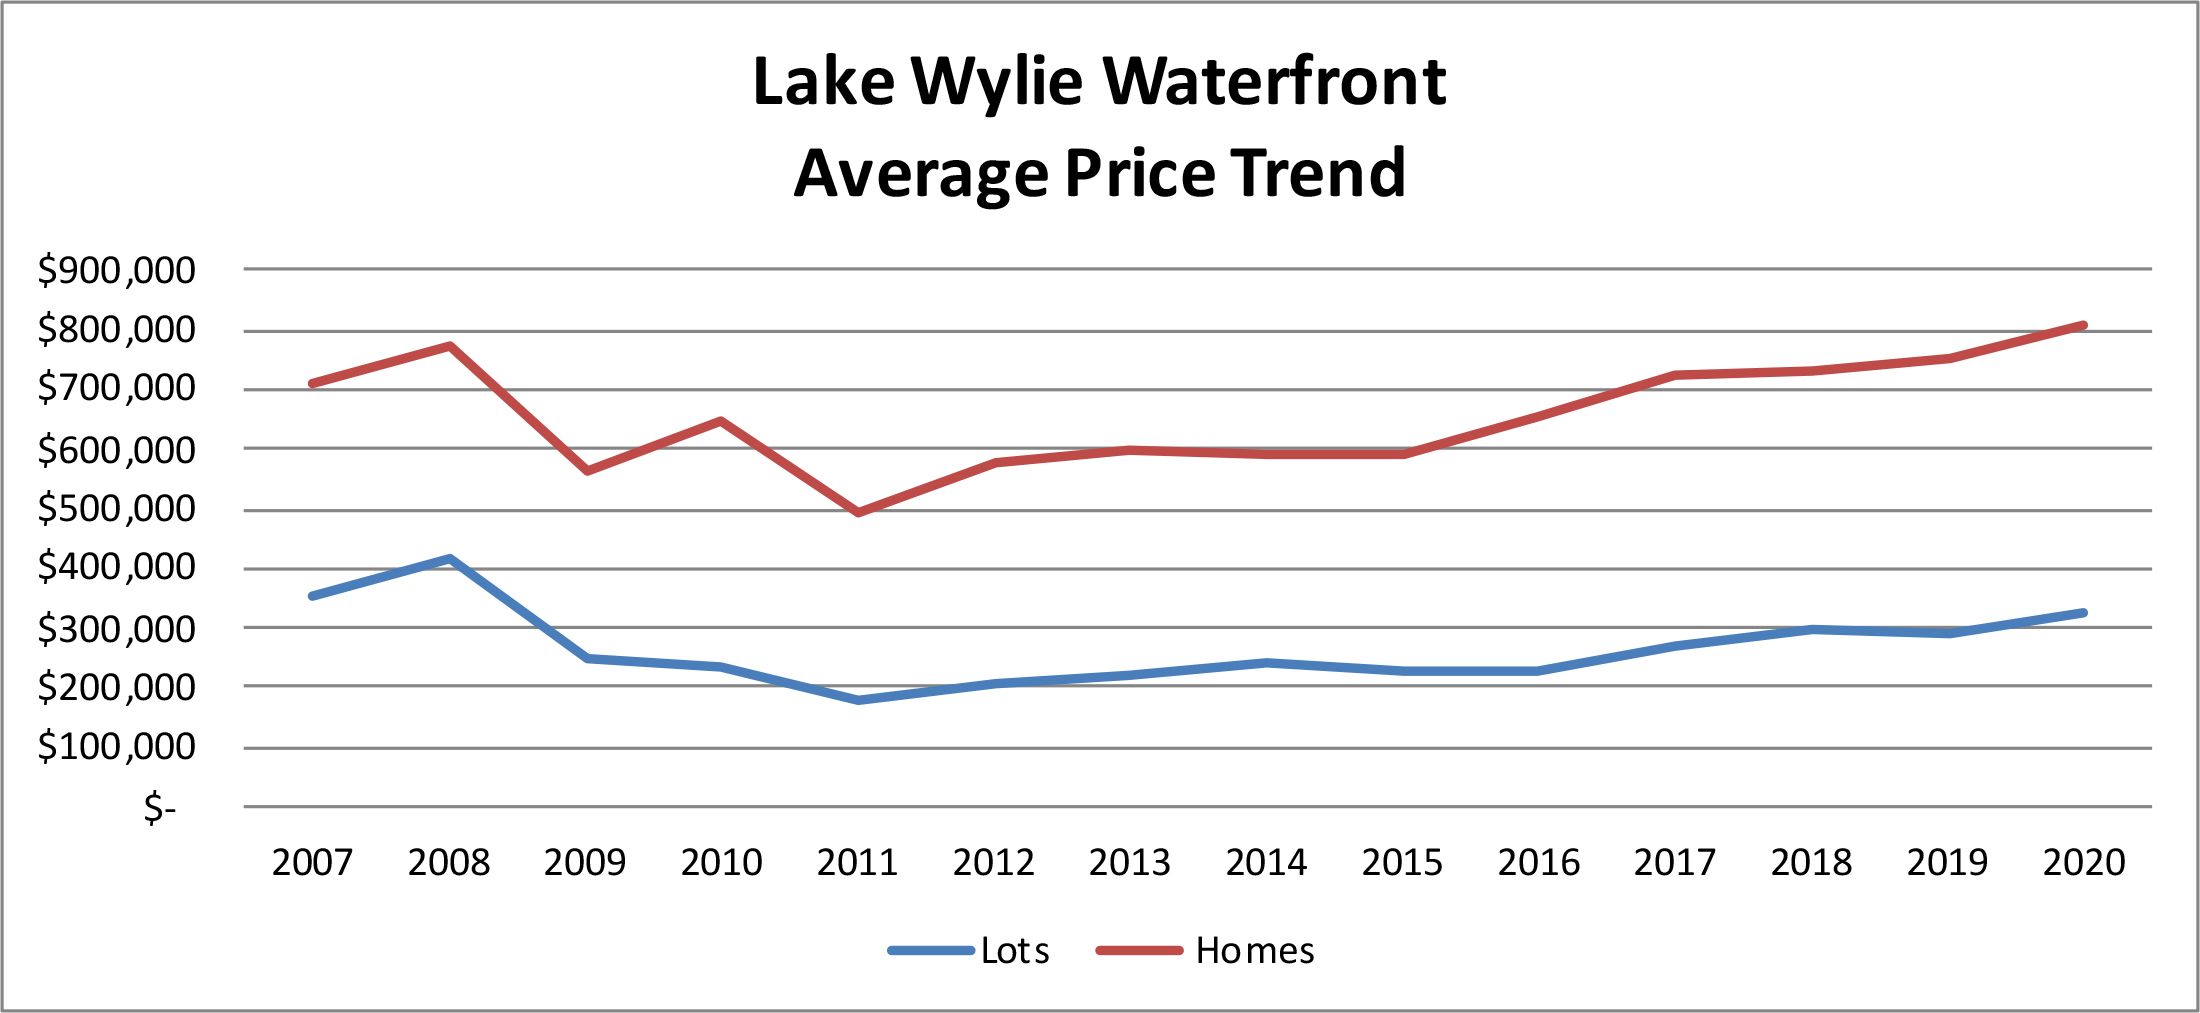
The nicest vacant lots were priced between $350k-$400k, and dockable land on Lake Wylie was plentiful.
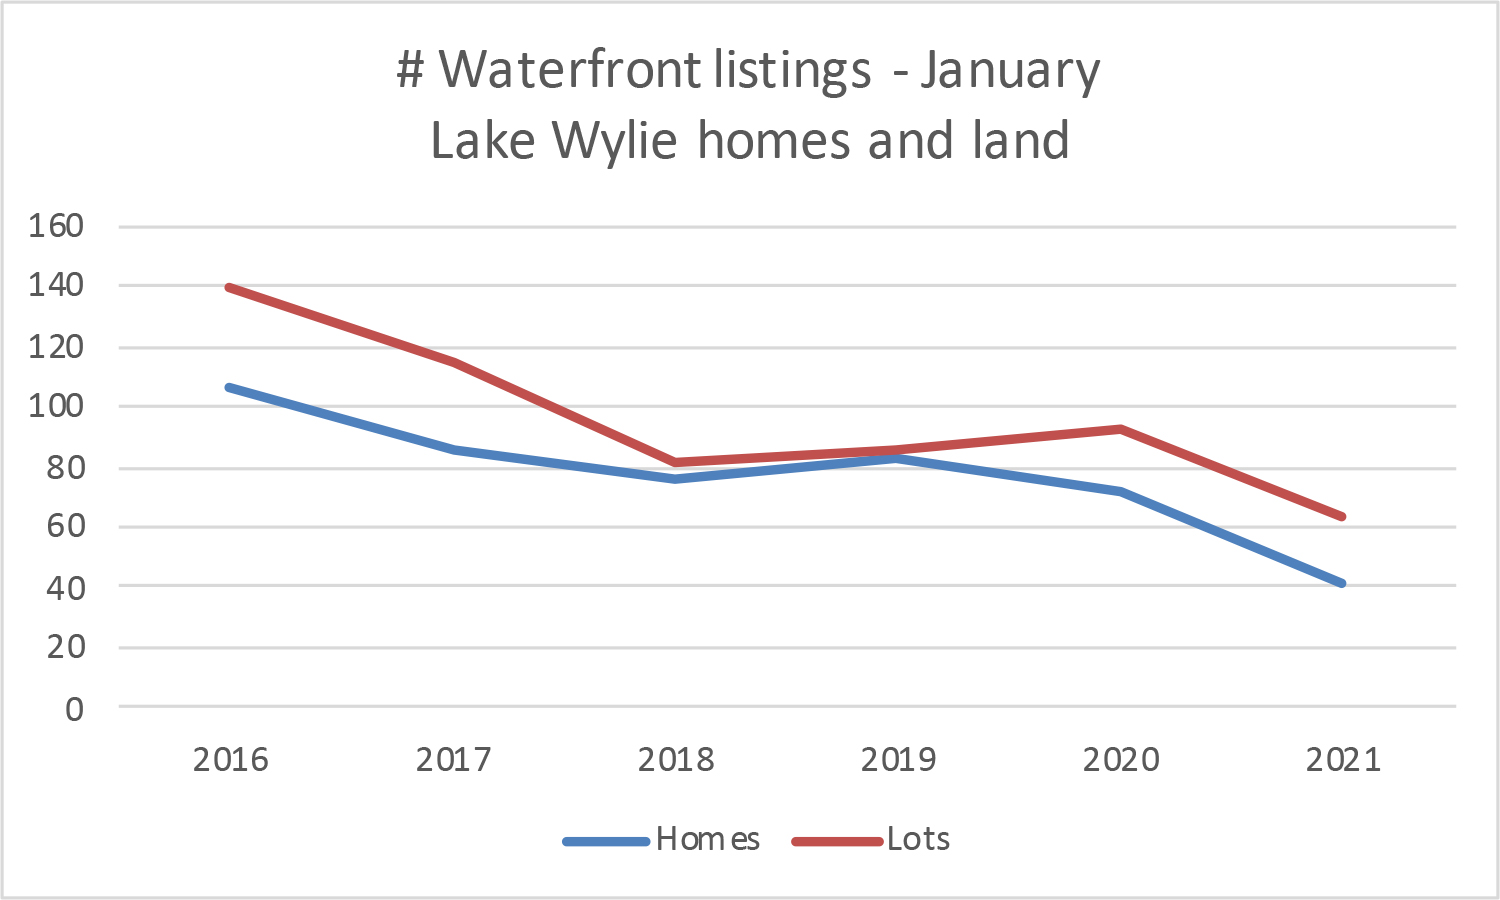
Now, there are only 13 dockable waterfront lots for sale on the lake — and the average price is almost $600,000 for an acre or less. Lots priced lower than a half million dollars are usually tucked in the back of a cove or have challenges in location, placement of power lines, or limitations in the building options. The average price is up more than 50% in comparison to last year, and the number of listings is at a historic low.
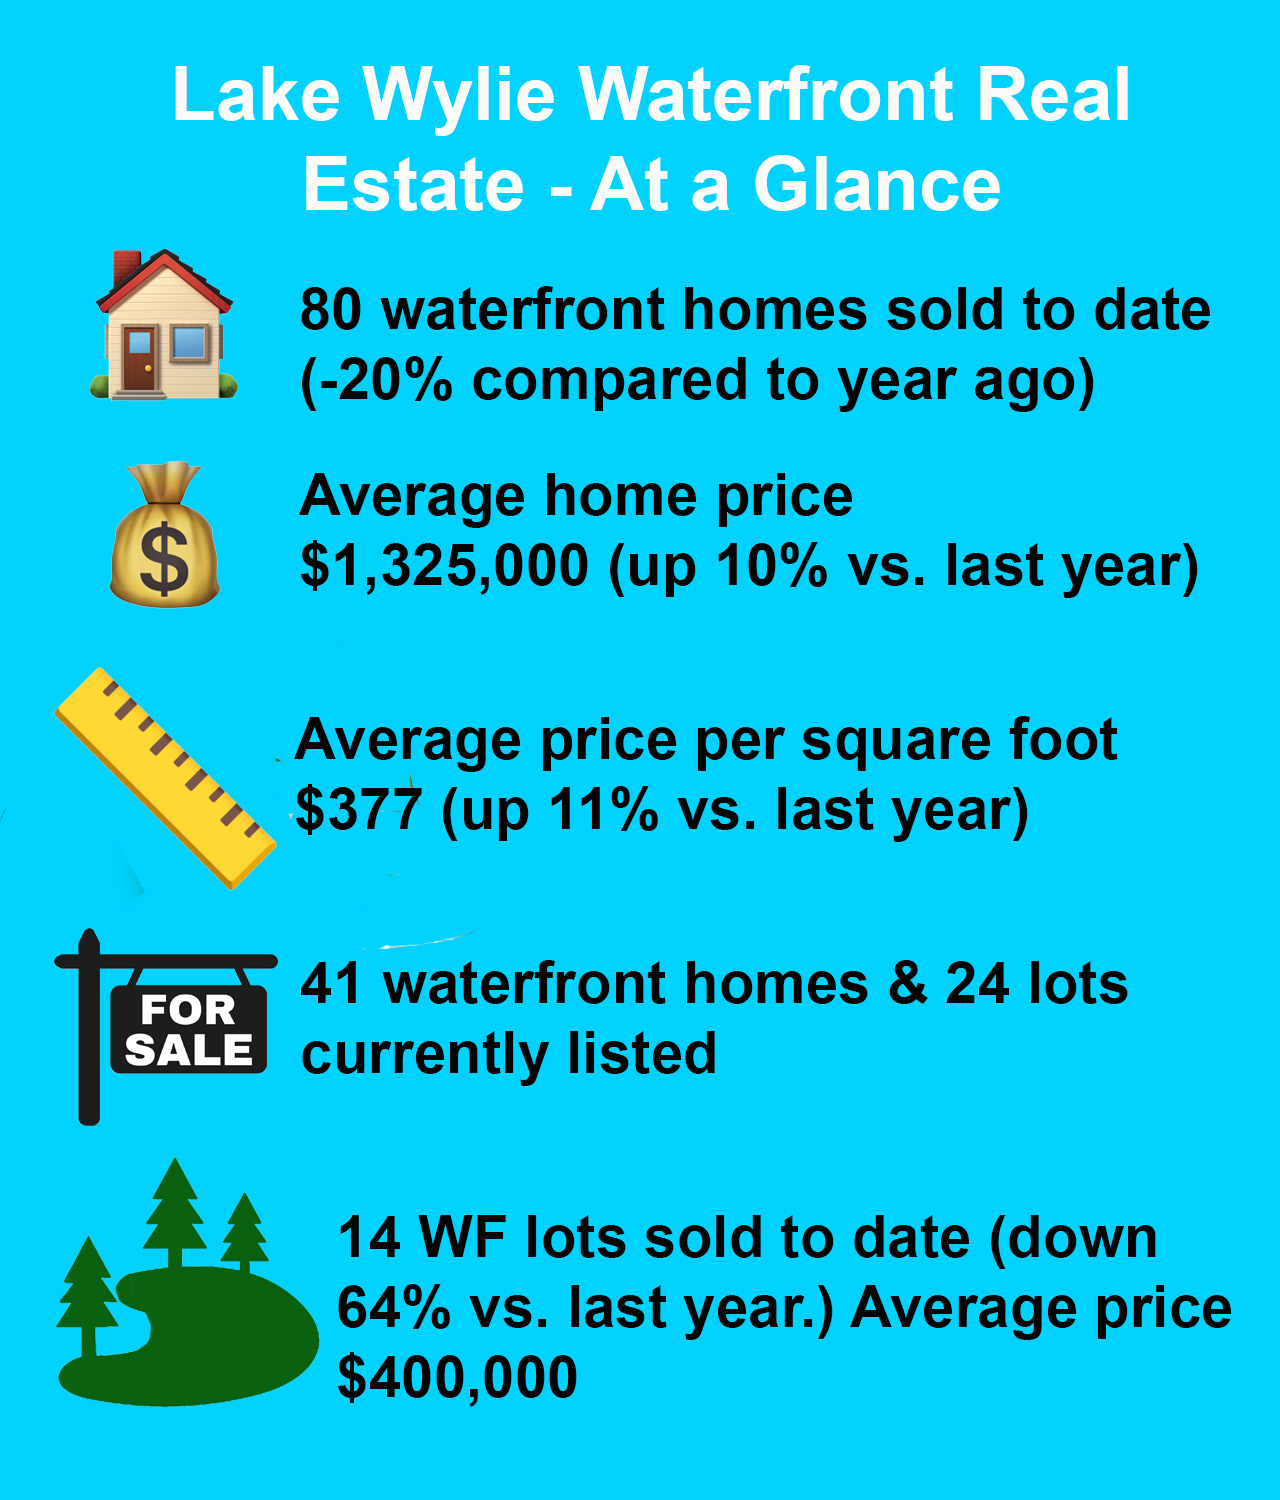
Here is a quick snapshot of other waterfront market statistics:
- Seven dockable lots closed in October, tying April for the highest sales activity this year. Two lots closed in The Sanctuary — a 12-acre parcel for $1.2 million and a 9.5 acre parcel for $700,000.
- McLean South Side opened Phase II with a $1 million, 1 acre lot on Kingbird Lane — which is in a section of the Belmont development that dips down across the state line into South Carolina. Two more lots, priced similarly, are currently listed on the MLS in that same section.
- A 0.4 acre lot in Joslin Pointe sold for $825,000 in October — the highest-priced parcel to ever sell in the neighborhood.
- Only one lot in available inventory is currently under contract, indicating a slowdown in sales for the remainder of the year.
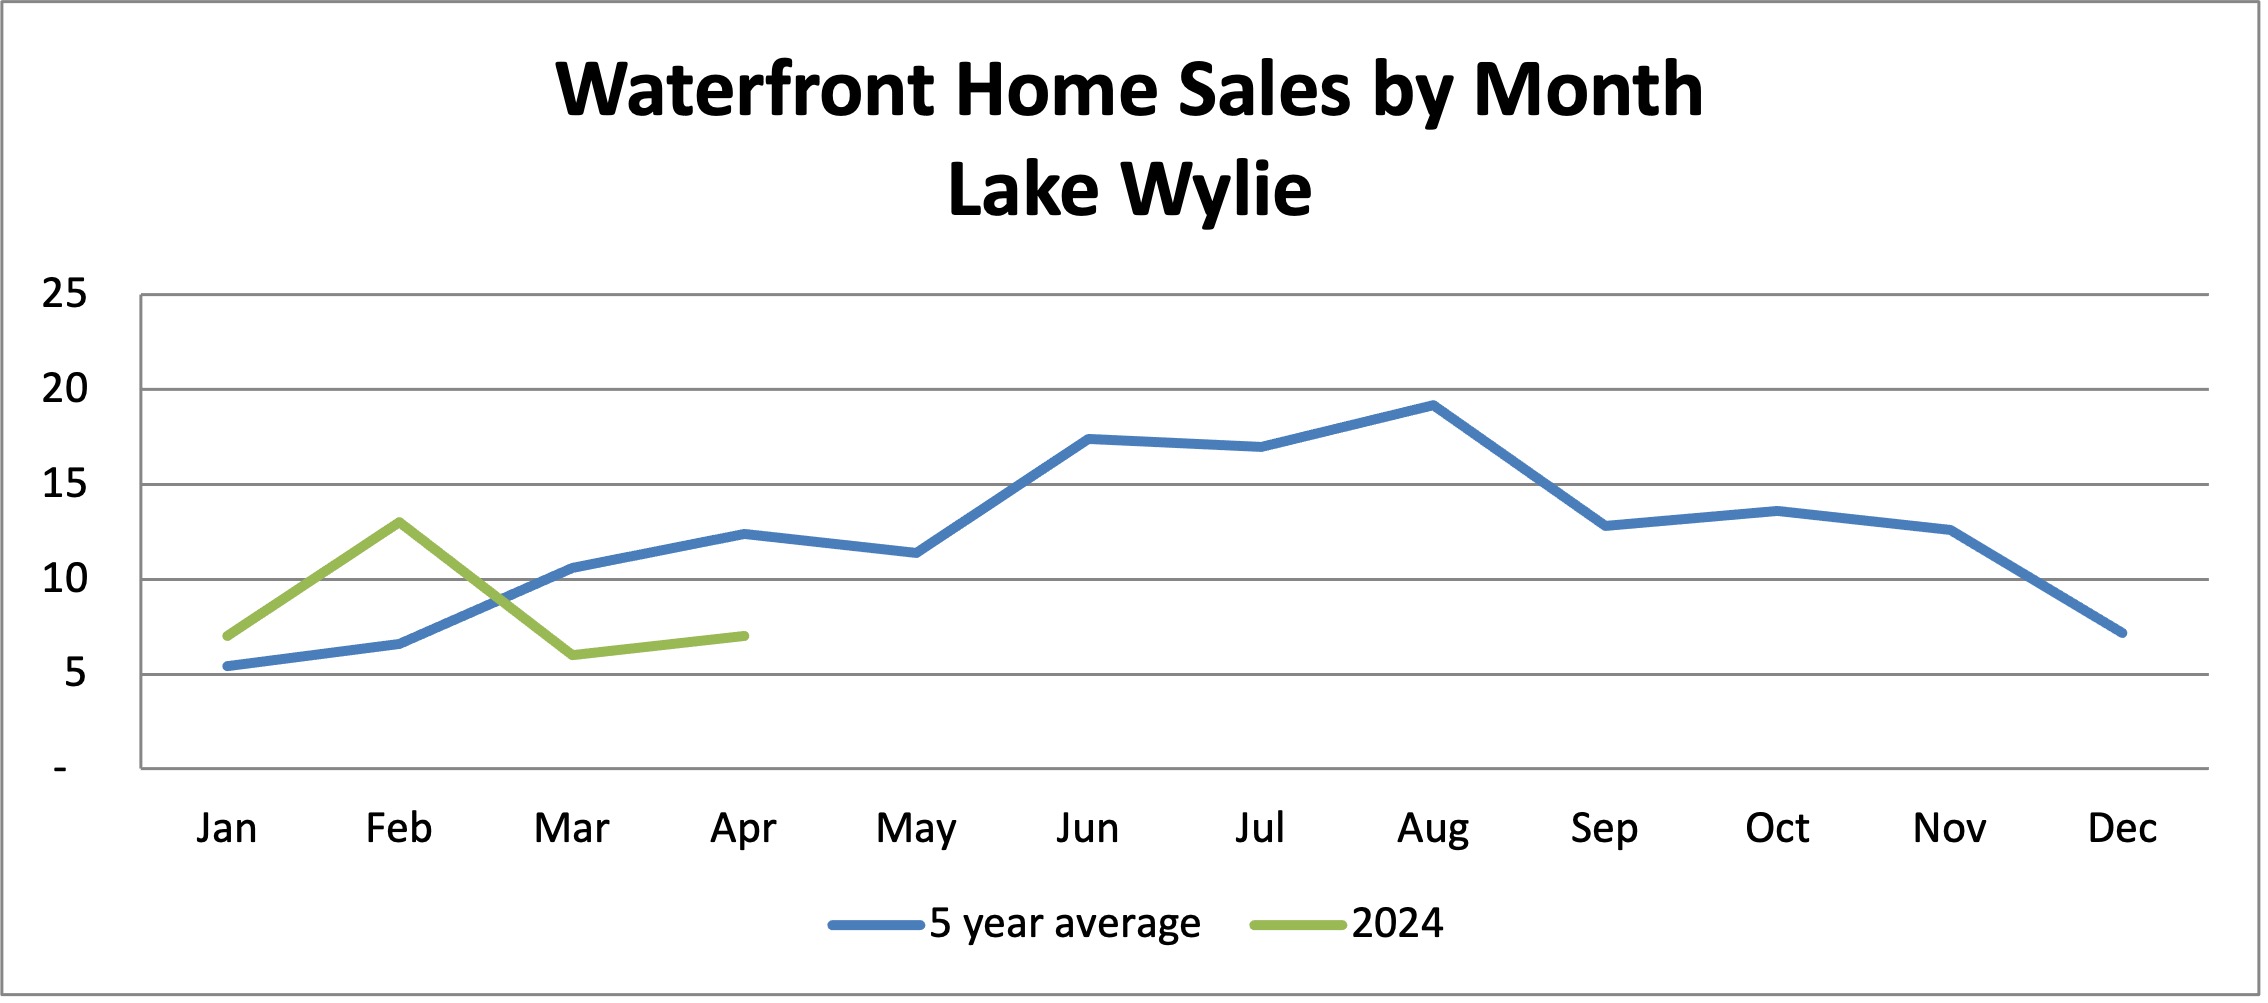
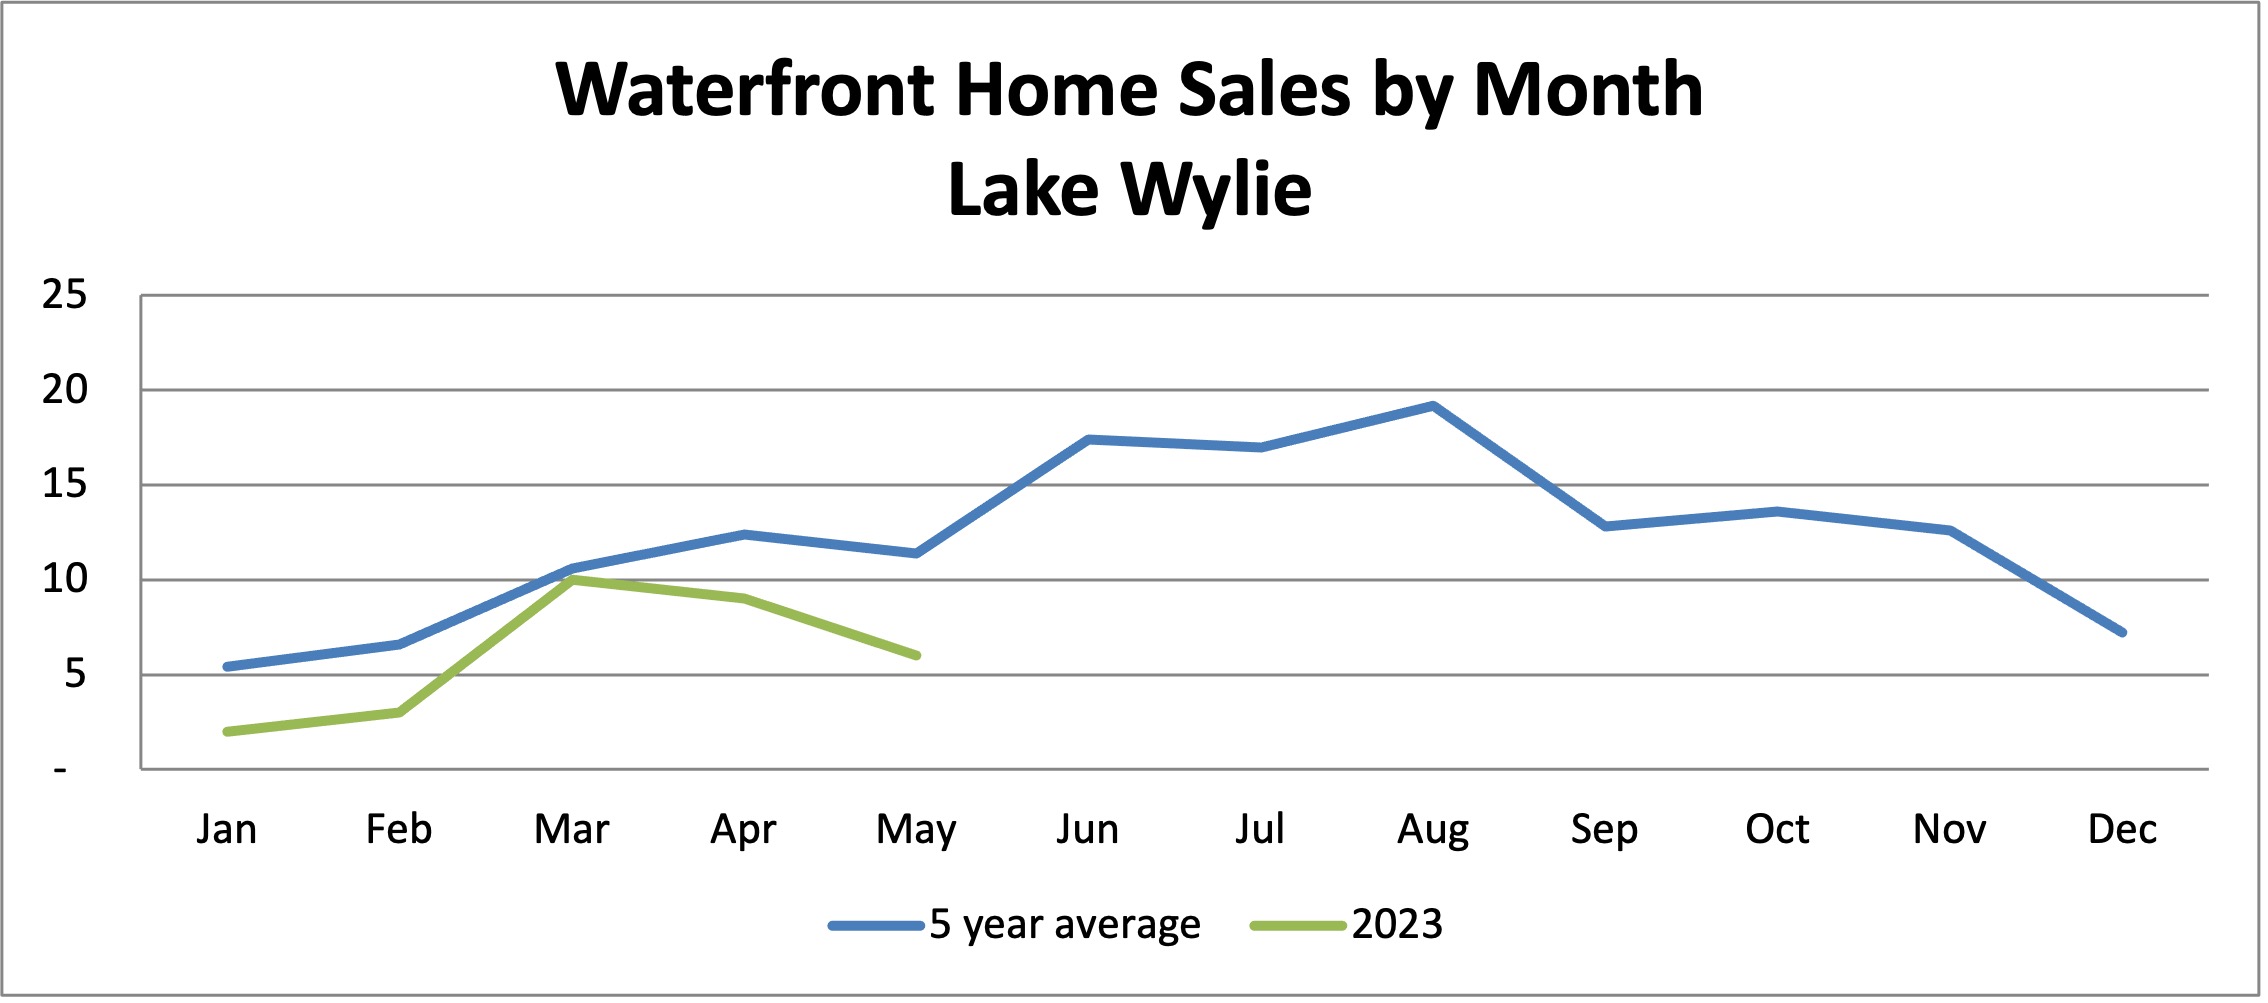
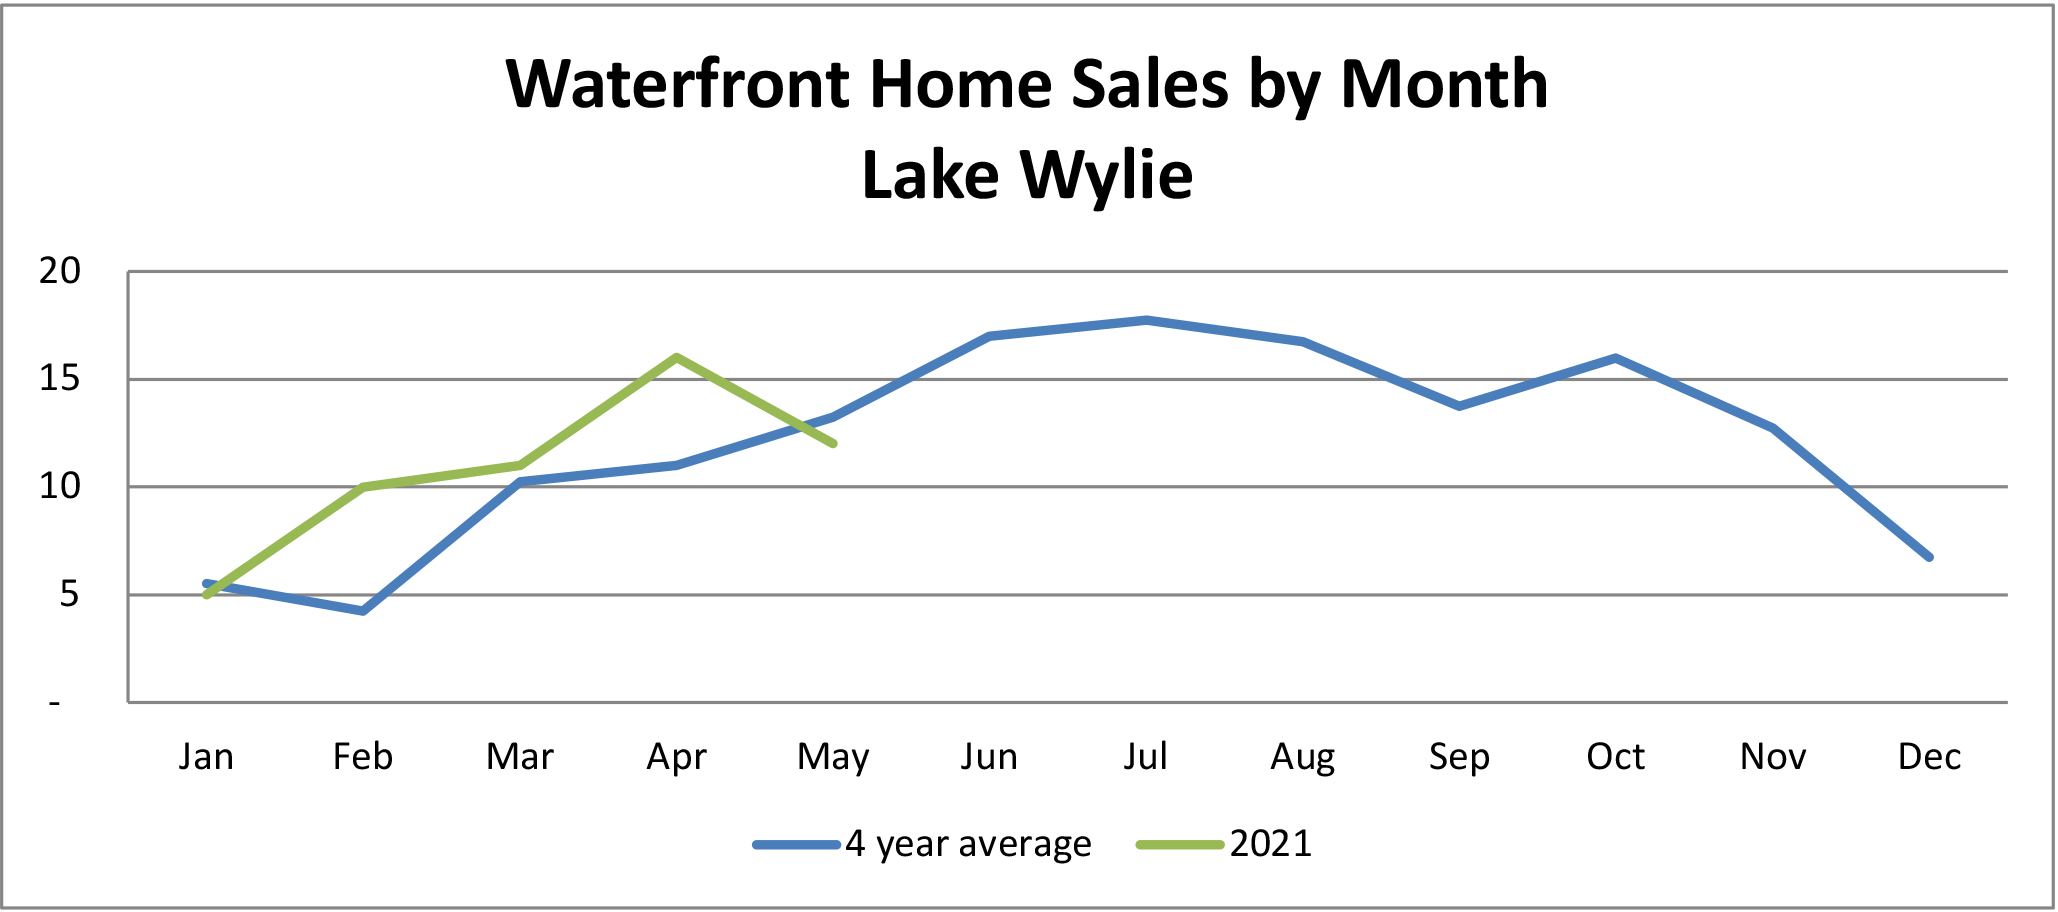
Waterfront home highlights:
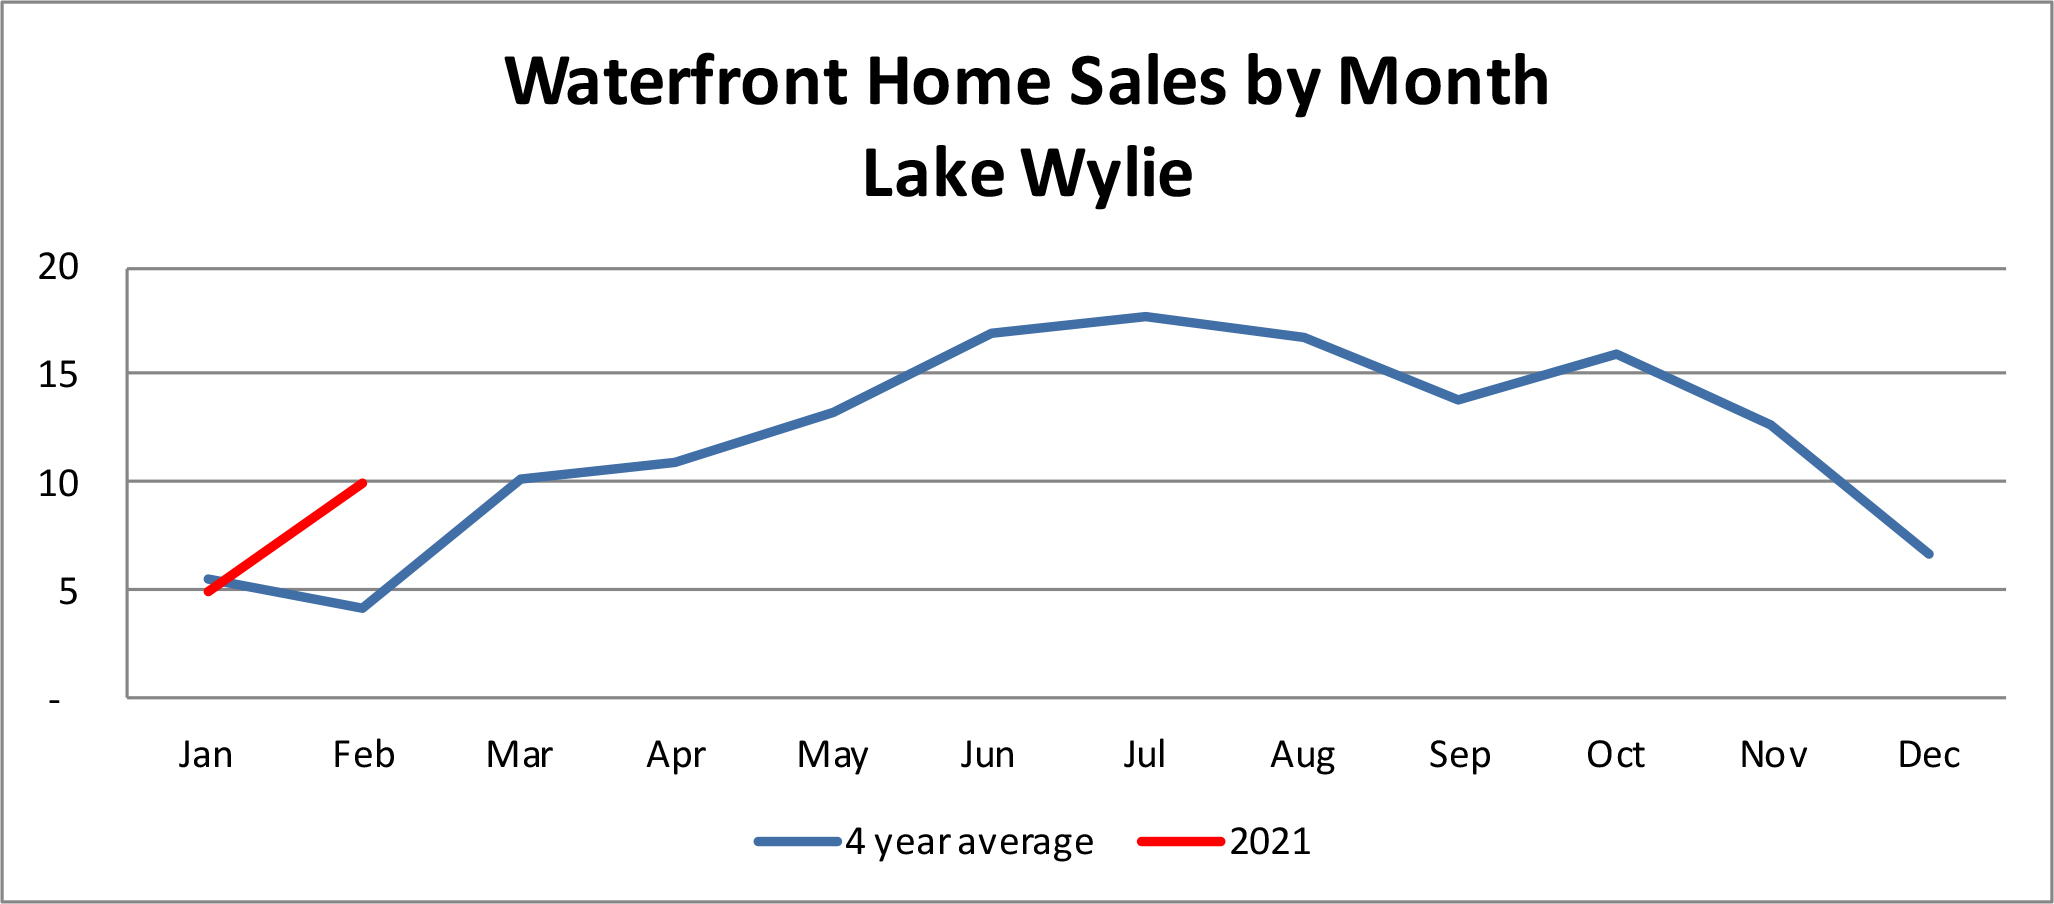
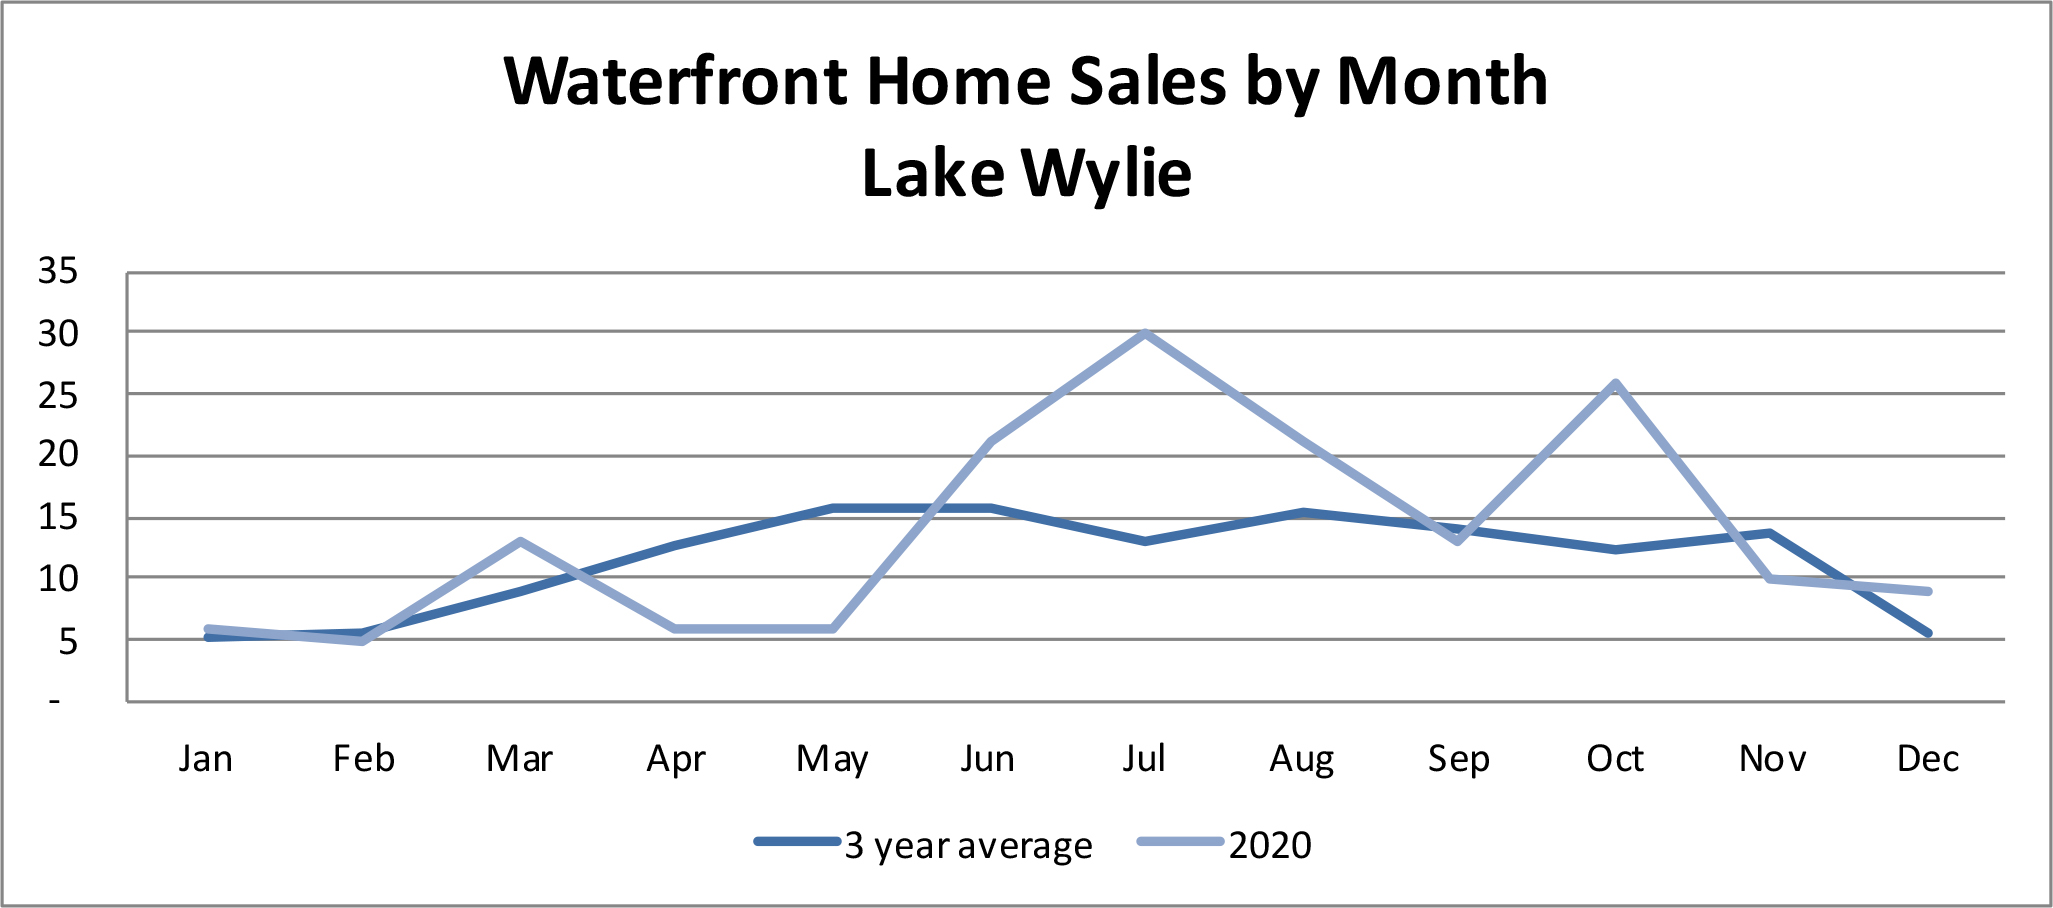
- Eleven waterfront homes closed in October, and there are 15 currently under contract. We’re on track to complete the year with sales about 25% above last year’s.
- Three homes that closed in October were originally priced over $2 million — but only one achieved that price point. Some sellers are trying higher prices just to see if a buyer will bite. While the strategy succeeds on occasion, a property priced too high often stays on the market longer, and sells for less, than a property priced right out of the gate. So far this year, properties that sold for 15% or more below the original asking price were on the market an average of 118 days. Properties that sold within 5% of the asking price averaged 20 days on the market.
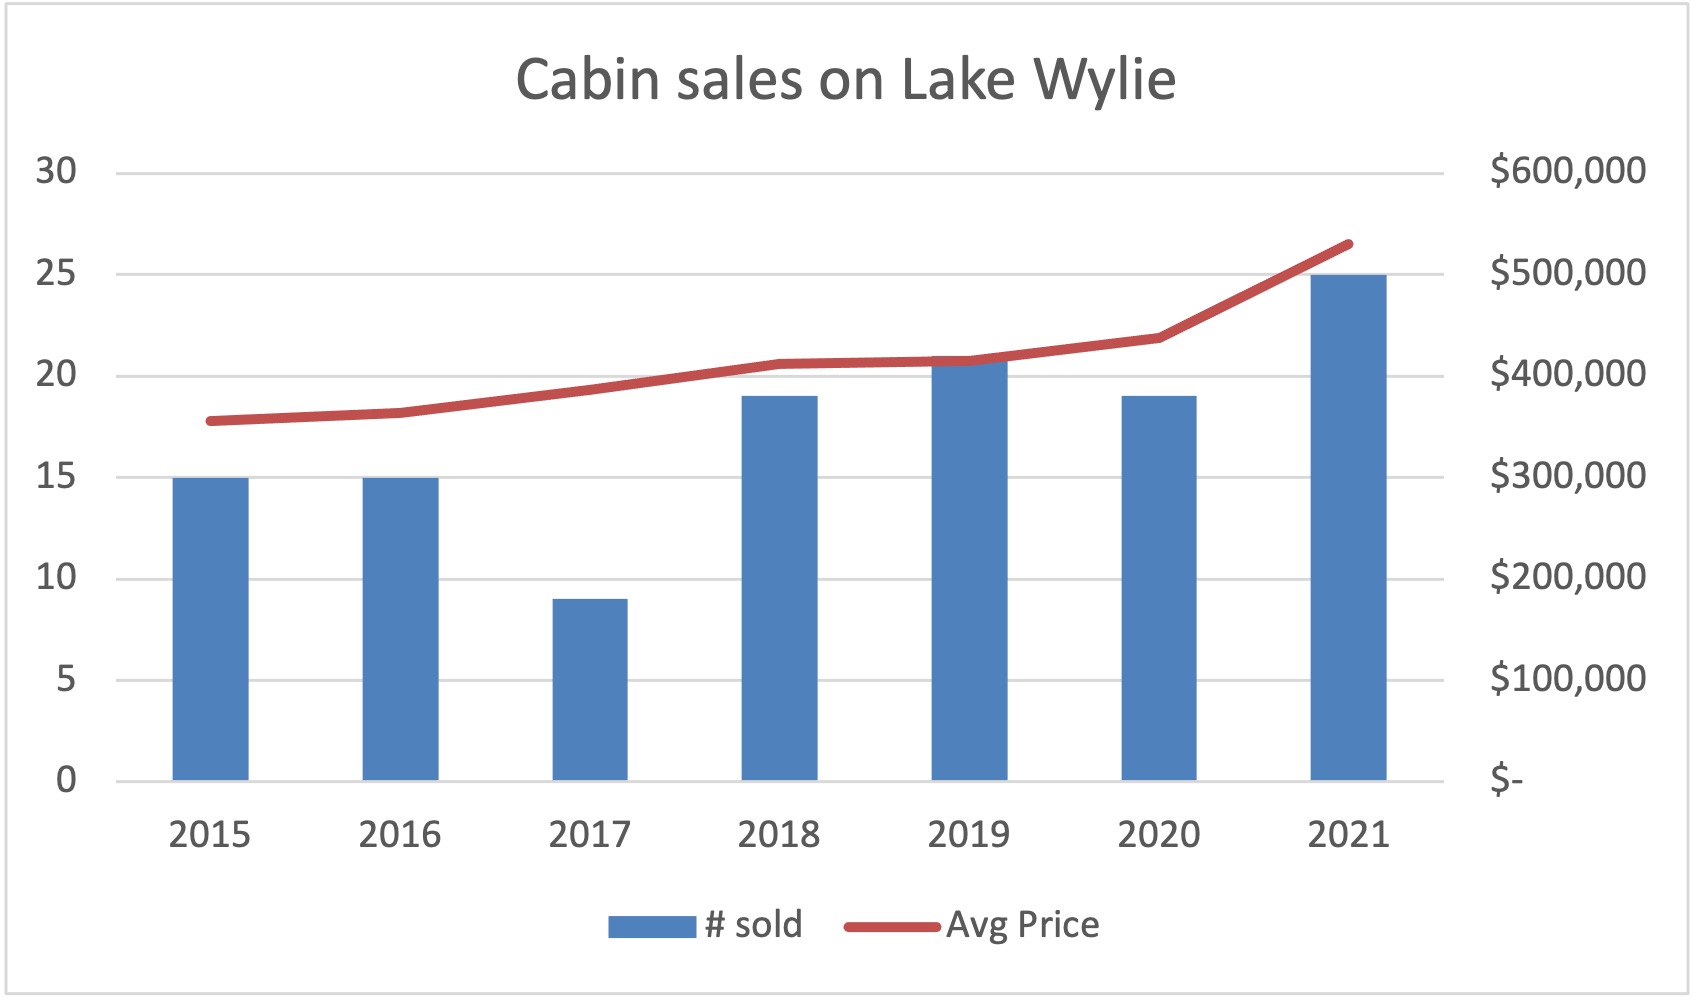
- Eighteen “cabins” have sold on Lake Wylie so far this year, for an average price of $900,000. Cabins are generally 2-bedroom homes built 40+ years ago, not originally intended as primary homes. Some have since been updated nicely and are suitable for full-time living.
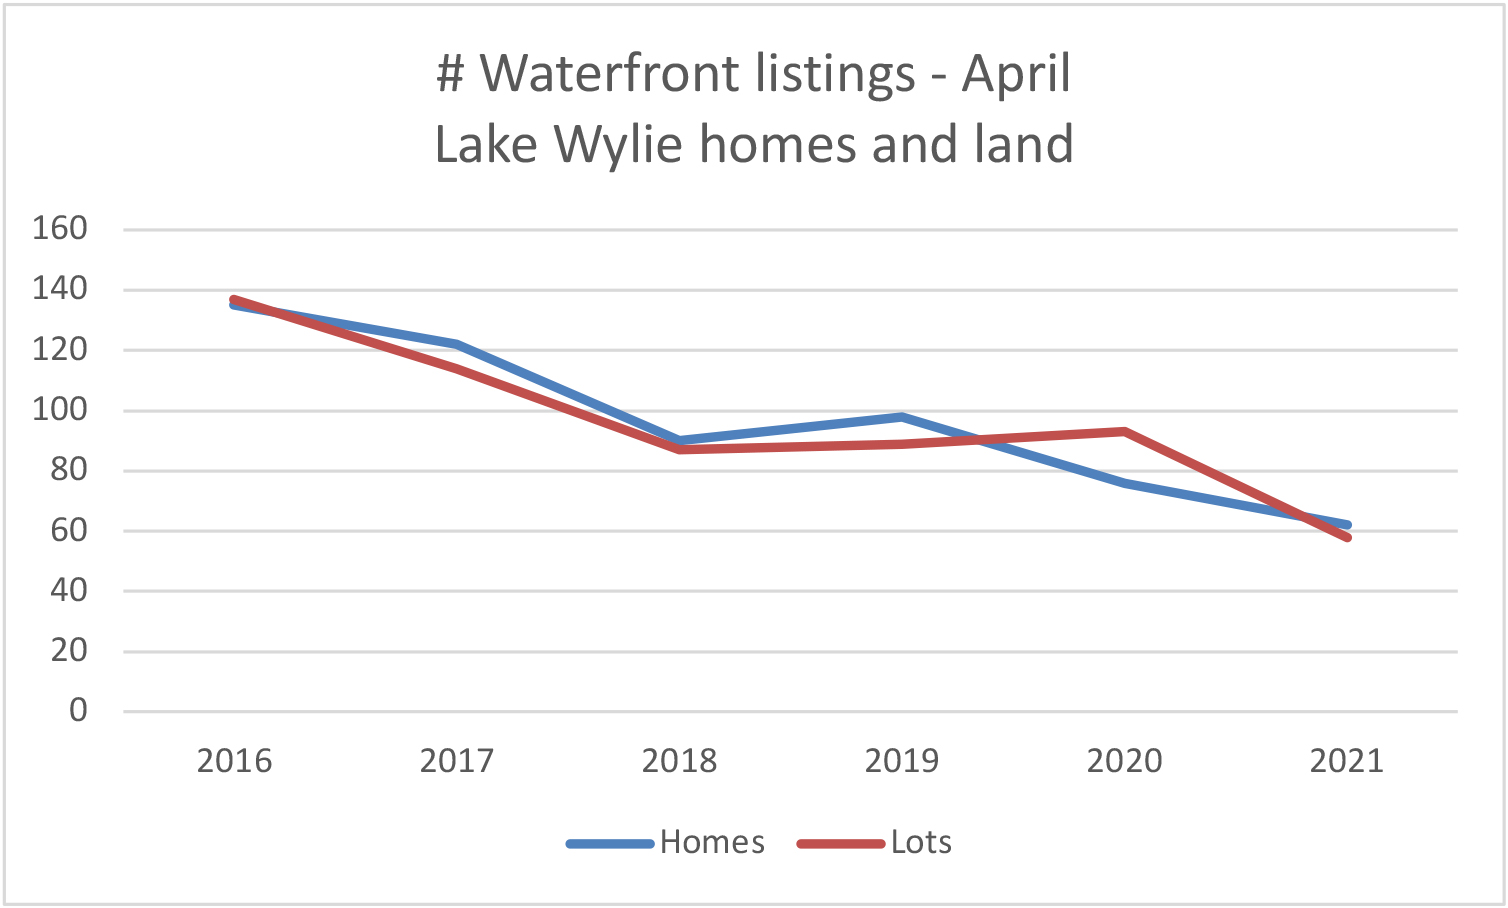
- The number of listings available for sale has dropped from a high of 66 in June down to just 51 waterfront homes on the market currently. The average price of homes in active inventory is $1.8 million.
For more information on all waterfront homes and lots sold on Lake Wylie this year, visit my webpages: Recent Waterfront Home Sales and Recent Waterfront Lot Sales. If you are considering selling your property, or have any questions about real estate on Lake Wylie, please give me a call. The Lake Wylie Man team has successfully closed hundreds of sales on the lake — far more than any other Realtor on the market. When dealing with the unique considerations of lake property, experience matters. I look forward to hearing from you!