Back-to-school may be just around the corner, but the summer real estate sales surge is still in full swing. We’re on track for the highest number of waterfront homes AND the highest number of waterfront lots sold in well over a decade of tracking. Lake sales are hotter than the dog days of summer!
According to a recent article in MoneyWise, South Carolina had the sixth-highest rate of population growth in the country, and North Carolina was on the new resident growth list as well. People are on the move, attracted by the beautiful natural resources in the Carolinas, as well as the lower cost of living in our suburban areas (compared to places in the Northeast and California.) The availability of larger lots, pleasant climate and laid-back lifestyle were also cited in the article as draws to our area.
Tight inventory and high demand have affected prices both on and off the lake, however. In comparison to 2020, average price per square foot has increased:
- Lake Wylie waterfront homes +25%
- Non Waterfront Homes in Mecklenburg County +23%
- Non Waterfront Homes in York County +22%
- Non Waterfront Homes in Gaston County +24%
The luxury home segment ($1 million+) has outperformed previous years. Year-to-date, 31 homes have closed in this price segment, representing 32% of total sales. Last year, 25% of waterfront home sales on Lake Wylie were priced over $1 million.
Waterfront lot prices are also climbing. Year-to-date average price for waterfront lots is about $350,000, a $25,000 increase over last year’s.
2021 Sales to date
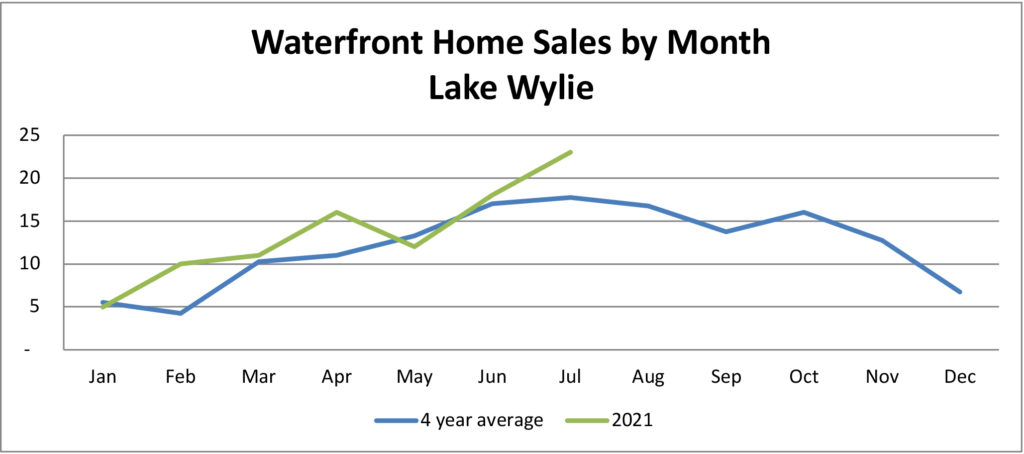
Lake Wylie waterfront sales trends kicked in place during the pandemic have continued through the summer of 2021. Sales by month are outpacing the 4-year average:
In the chart above, the blue line represents the average number of waterfront homes sold on Lake Wylie by month during the past four full years. The green line represents monthly activity for 2021. Most months have outpaced the average, and year-to-date sales are up 22% over the average.
Waterfront lot sales vary more in yearly totals as well as monthly seasonality. Year-to-date sales are almost double last year’s sales through the end of July.
Waterfront Listings
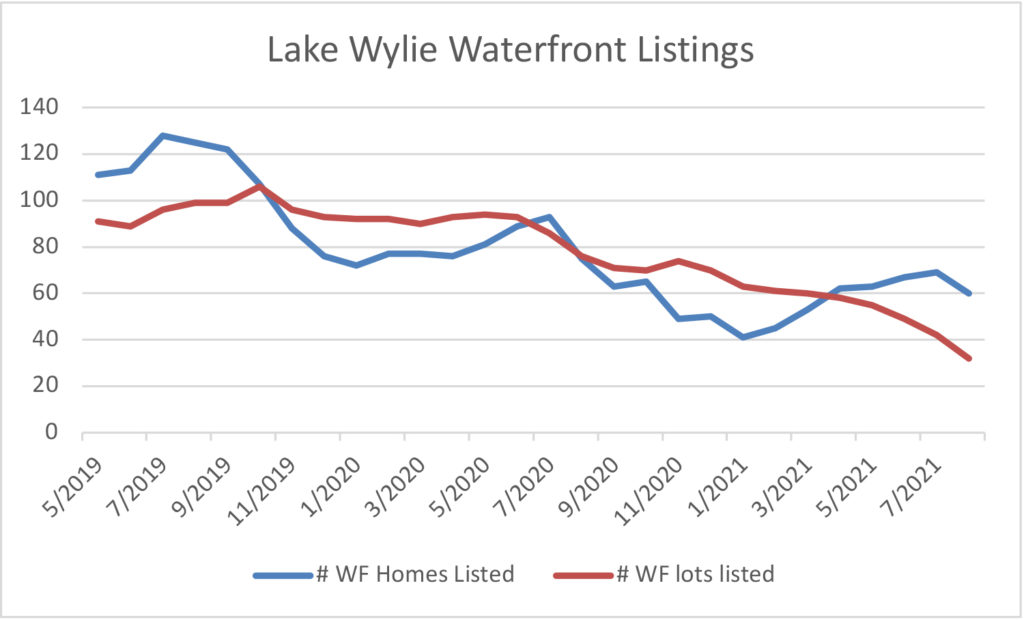
Meanwhile, the number of listings continue to decline:
In the chart above, the blue line represents the number of Lake Wylie waterfront homes on the market from month to month (including those under contract but not yet closed.) The red line represents waterfront lots.
While waterfront home listings have trended upward since the first of 2021, the numbers have declined year-to-year. Listings at the first of August are down 20% from last year, and 52% from 2019 inventory levels in August. In addition, the portion of listings classified as “under contract” is greater. Currently, 60% of waterfront home listings are under contract, leaving just 24 homes fully “available” on the Lake Wylie market.
Typically, the number of waterfront home listings peak in July and begin to trail off as summer ends.
Waterfront lot listings have continued the steep decline. As of this week, there are only 32 dockable lots listed on Lake Wylie.
Newly listed properties continue to sell quickly. Well over half of waterfront homes sold this year were on the market less than a week, and 70% were on the market less than a month. Many sell for full asking price or above.
Recent waterfront property sales can be viewed on my website, Recent Waterfront Home Sales and Recent Waterfront Lot Sales.
In this aggressive market, expert advice is more important than ever. Please call if you’re considering selling your home or lot. As the #1 Lake Wylie waterfront team for well over a decade, The Lake Wylie Man can assist you in determining the best price, sales strategies and marketing for your property, resulting in the best outcome and smoothest closing possible.


