Lake Wylie real estate
A hot market in the dog days of summer
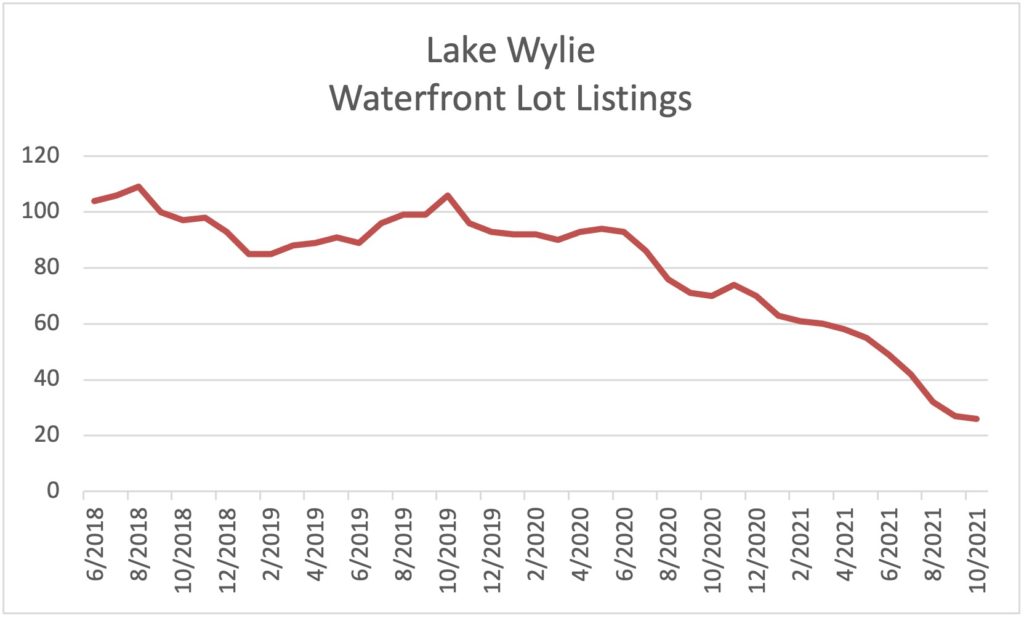
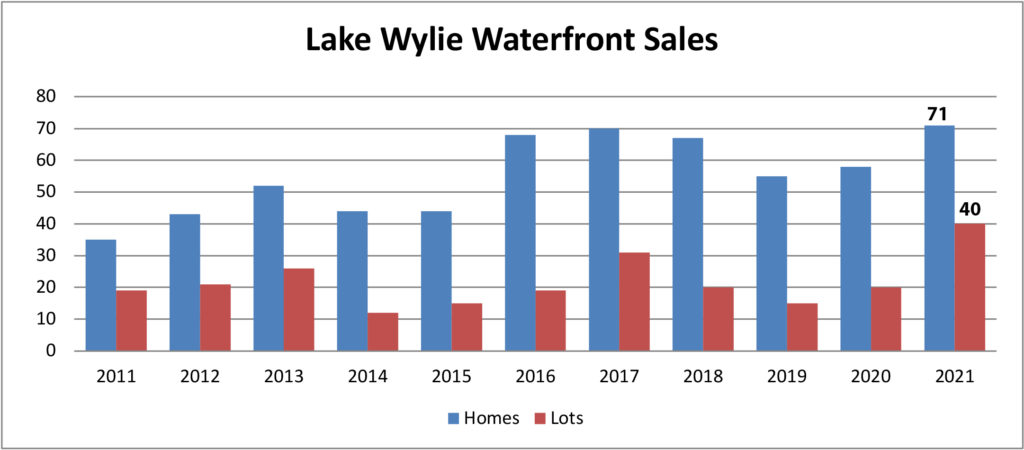
Back-to-school may be just around the corner, but the summer real estate sales surge is still in full swing. We’re on track for the highest number of waterfront homes AND the highest number of waterfront lots sold in well over a decade of tracking. Lake sales are hotter than the dog days of summer!
- Lake Wylie waterfront homes +25%
- Non Waterfront Homes in Mecklenburg County +23%
- Non Waterfront Homes in York County +22%
- Non Waterfront Homes in Gaston County +24%
2021 Sales to date
Waterfront Listings
Mid-year 2021 Waterfront Sales Update
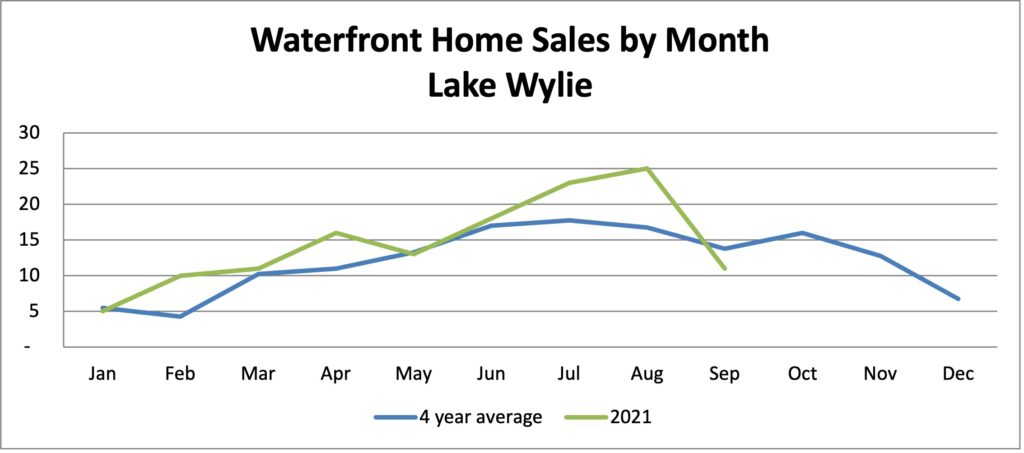
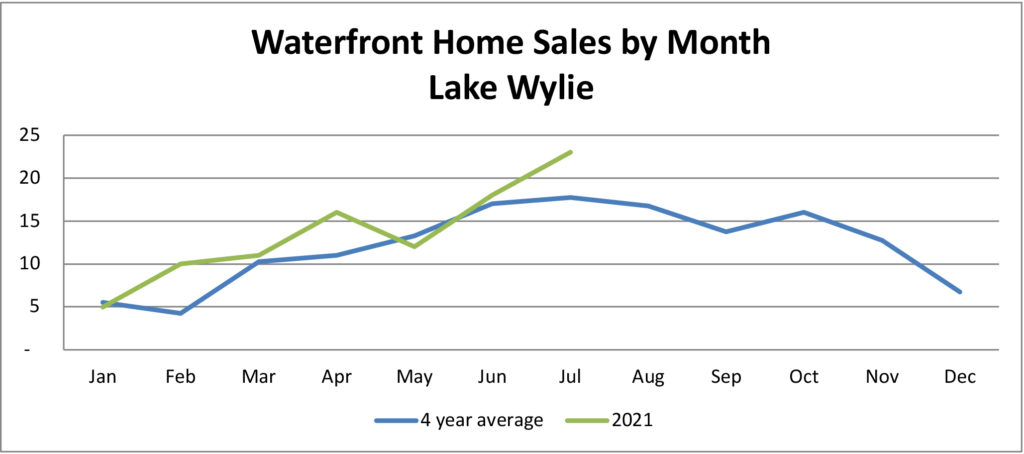
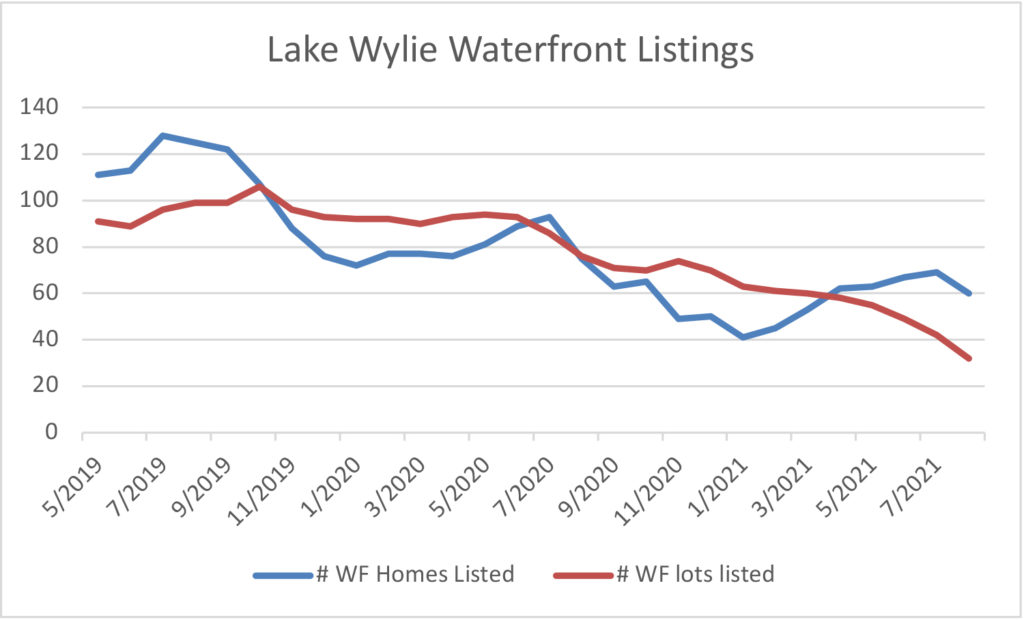
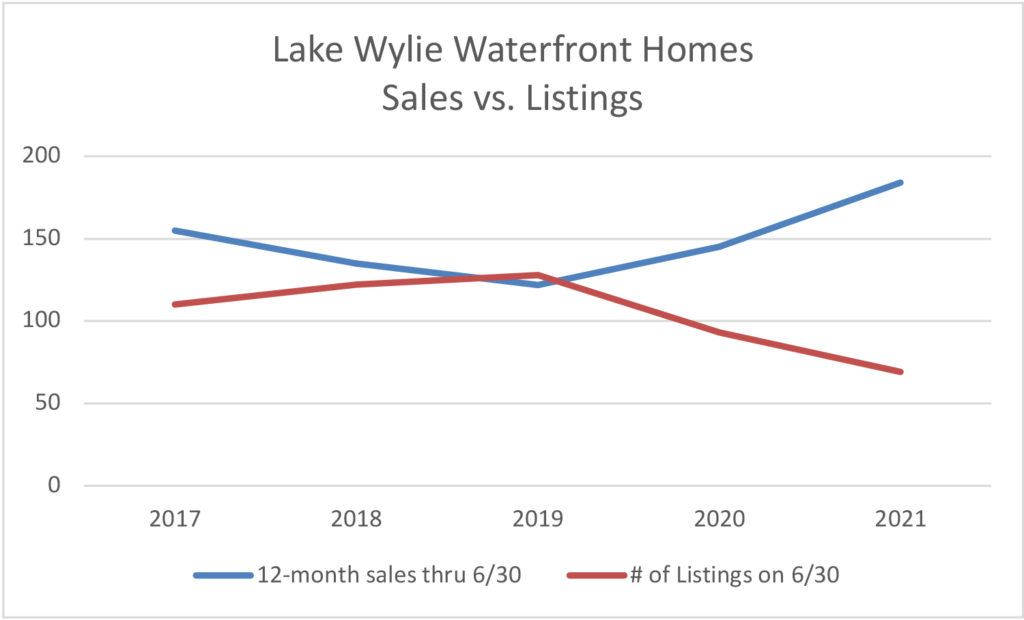
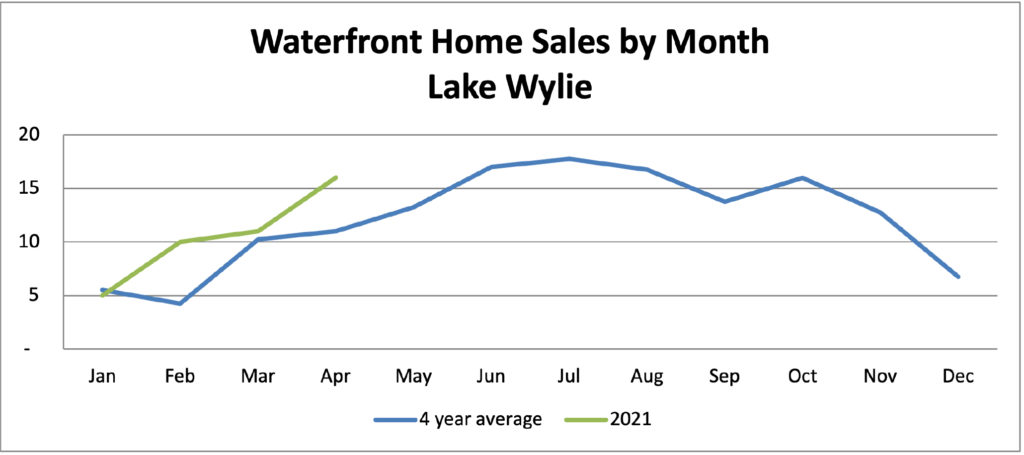
The wild ride continues in real estate — on Lake Wylie and around the country. Sales are breaking records — which is quite a feat considering the number of listings is at an all-time low. We are starting to see just a little slowing in sales in waterfront homes, but that is simply because there are so few homes available to sell. Compared to a 4-year average by month, sales outpaced previous years in the first quarter of the year and have begun to lag below average the past couple of months:
- The average time on the market for Lake Wylie waterfront homes is just 30 days. (For reference, the average time on market for 2020 was 115 days.)
- Over half of waterfront home sales occurred in the first week of listing.
- Over half of waterfront homes sold at or above the listing price.
- The average sales price for a cabin (property designed for “weekend use,” usually built 50+ years ago, usually under 1200 square feet or so) reached $506,000 in first half 2021, a whopping $70,000 increase over last year’s average.
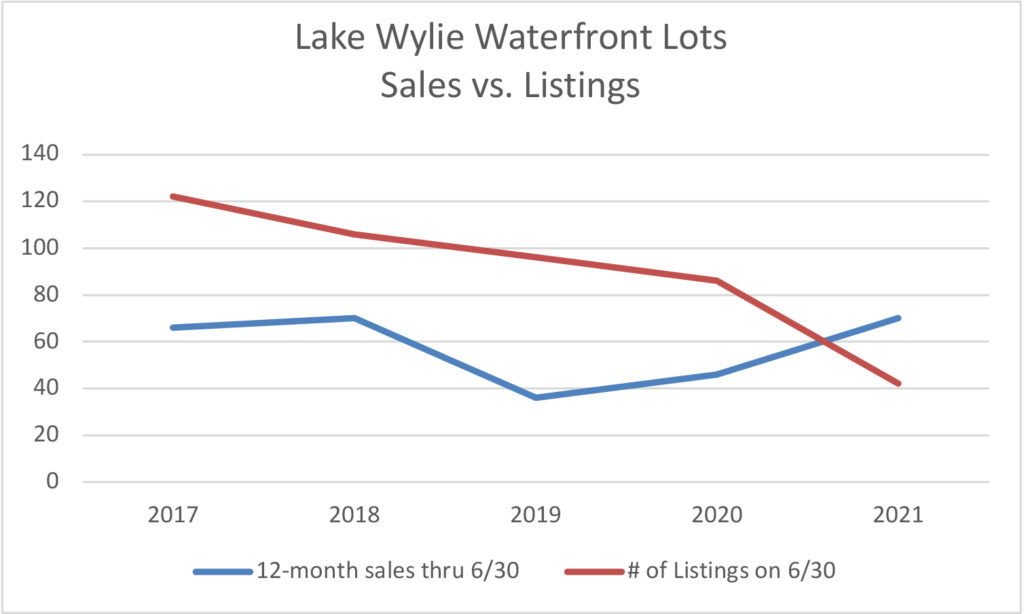
- About 25% of waterfront lots sold were on the market less than a month. Also, several lots that were on the market for several years have sold.
Spring Frenzy – Lake Wylie Real Estate Market
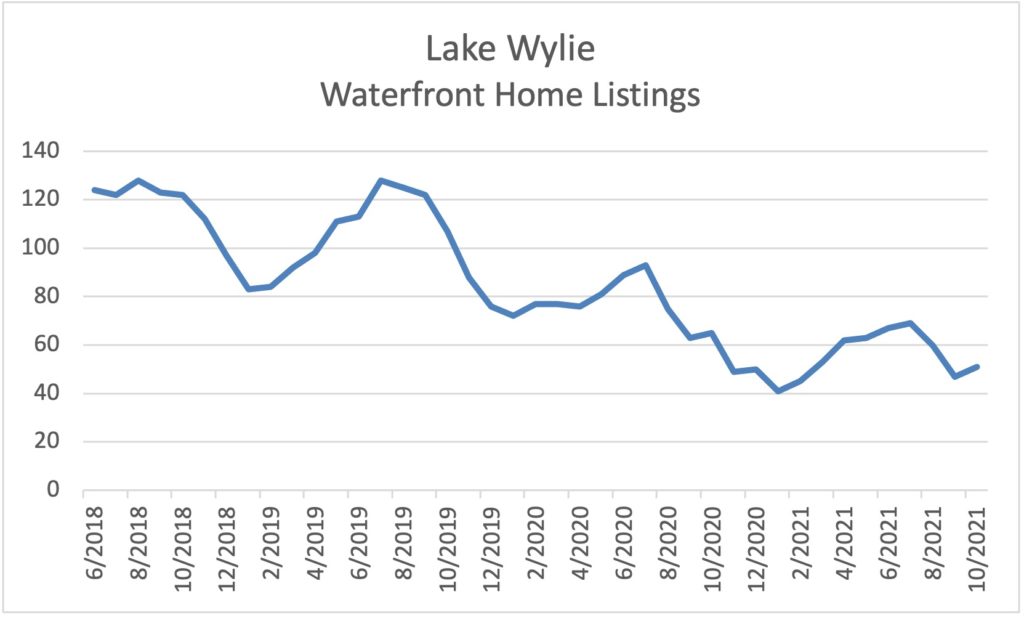
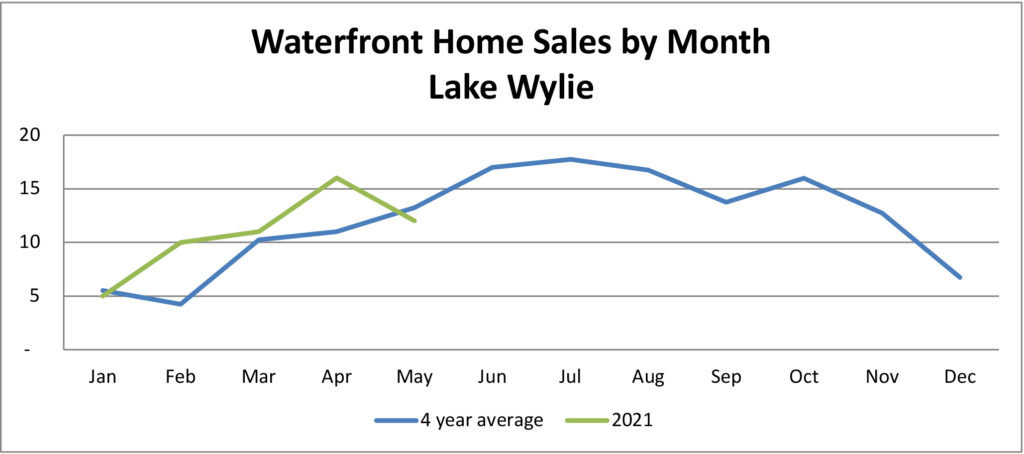
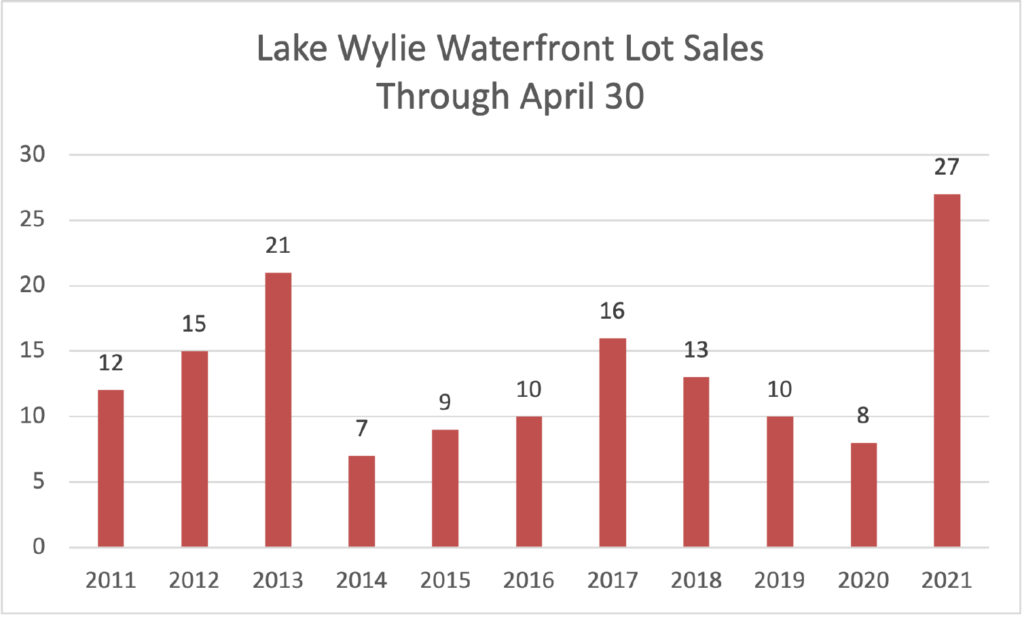
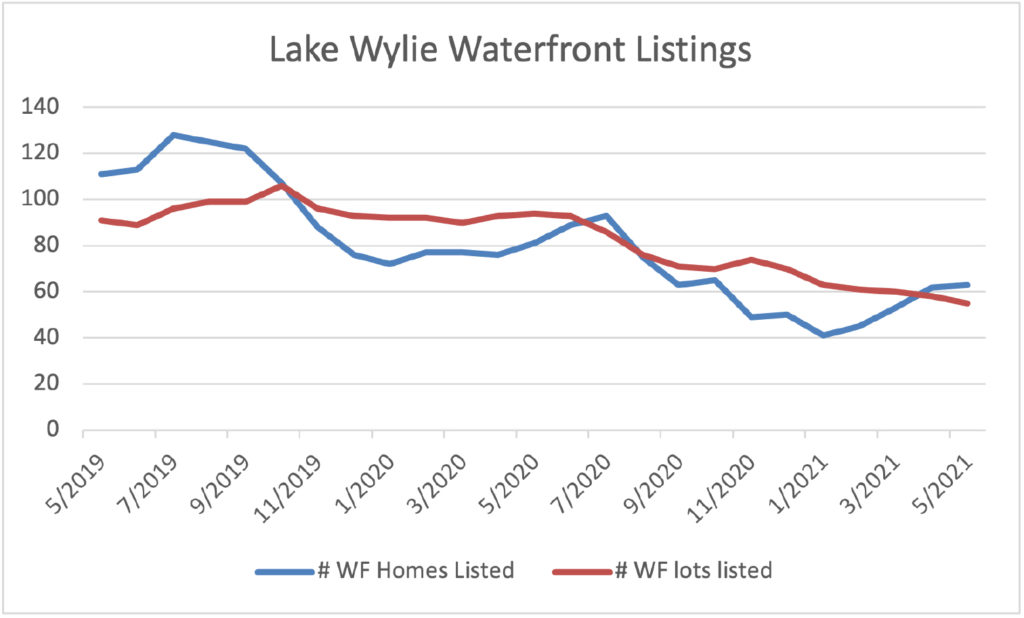
The frenzy continues in real estate sales on Lake Wylie this spring. Both waterfront homes and dockable lots are selling at record paces — the highest number of sales through April in over a decade. At the same time, the number of springtime listings is at the lowest point in years.
People are on the move, all over the country:
Americans are leaving the big cities, but they’re not going far. According to Bloomberg CityLab, they’re heading out to the suburbs, places with a little more space and access to outdoor amenities (like Lake Wylie!). About 84% of movers stayed within their same metro area.
In the Charlotte area, the mover inflow/outflow ratio was pretty flat — which means we didn’t have a large increase or decrease in population change during the pandemic, but people did shuffle around.
Real estate is big news. Prices are climbing, multiple offers and bidding wars are common, and supply (number of listings) is very, very low all over the country.
For several years after the recession (2007-2010ish), new construction slowed considerably — and we’re now feeling the supply pinch.
Though building has started up again in the Lake Wylie area, costs are high, particularly as the pandemic affected the supply of materials.
The ability (and, during the pandemic, the necessity!) to work remotely, combined with low mortgage rates, has encouraged people to start buying houses.
So, here we are. Waterfront home sales are outpacing the 4-year average:
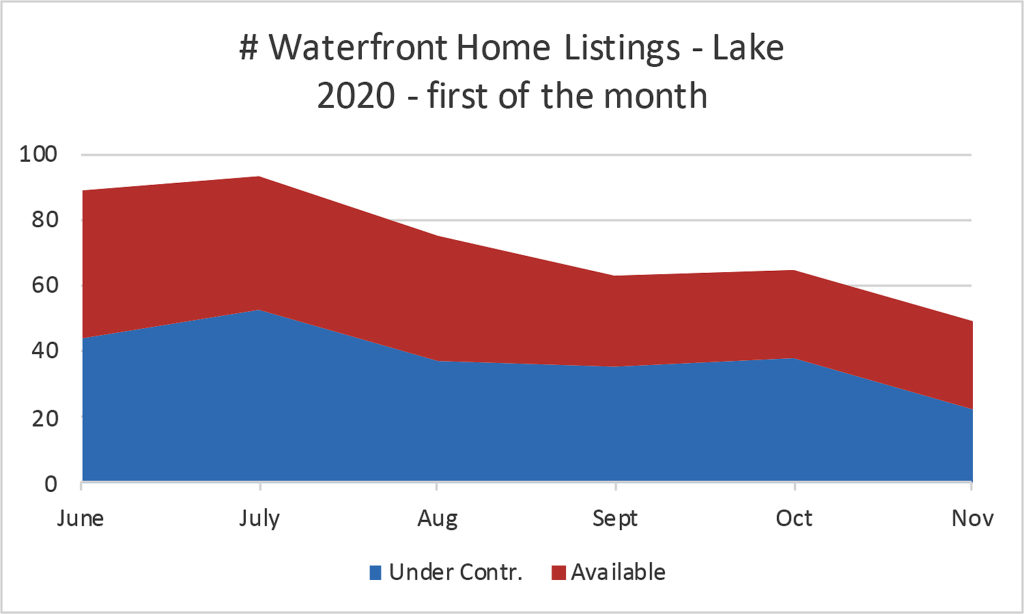
A roller-coaster ride in real estate – November 2020
October numbers are in for Lake Wylie real estate activity, and It has certainly been a roller coaster ride!
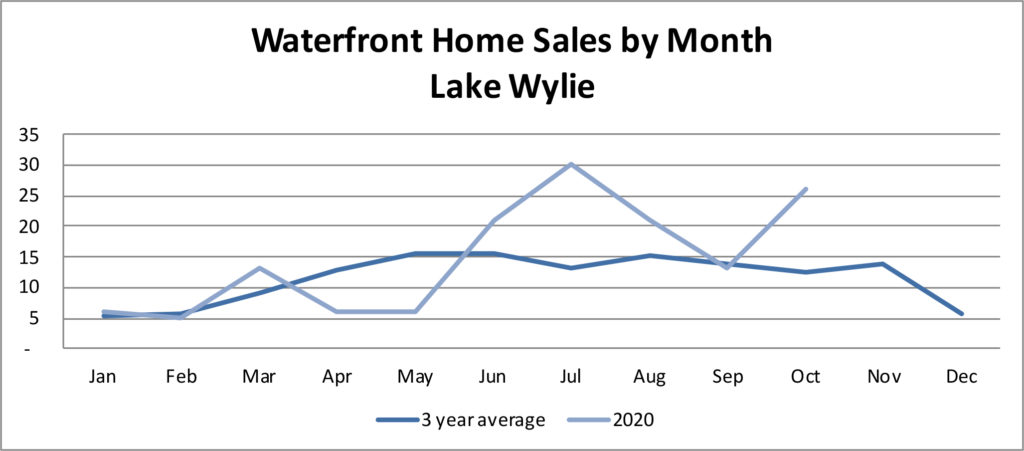
TWENTY-SIX waterfront homes closed in October — a month that usually averages 8-10 closings. Last year the market had a record-breaking October, with 16 closings. Check out this year’s performance in comparison to the past 3-year average:
Waterfront Lots – The Market is Hot!
After analyzing monthly waterfront sales for well over a decade now, I know not to put too much importance on what happens in January. Weather, lake levels, and inventory levels are often off-kilter in the winter months, and all of these impact buyer activity. Plus, the winter months are the least active for sales both on and off the water, so first quarter closings don’t always provide a great indication of how the year will turn out.
That being said, with SEVEN waterfront home closings and SIX dockable lot closings in January, the market came out of the gate the strongest it has in several years. In addition, there are currently 24 waterfront homes under contract, and 6 lots, which is impressive given the low inventory levels that plagued us in recent months. Of the homes that are currently under contract, six (25%) were on the market for less than a month.
We have buyers waiting in the wings, ready to purchase, and with record low inventory levels, new listings get a lot of attention quickly. (Pause for a commercial break!) It is particularly important to price your property correctly, prior to listing, and make sure that potential issues are addressed and the property is ready to sell, and having a Realtor experienced in waterfront is vital.
So, what’s selling? Homes under contract are equally disbursed between Belmont, Lake Wylie (Clover School District), and Charlotte, plus a couple of properties in Tega Cay area. The higher priced properties represent the bulk of sales, with 9 over $1 million, and 8 priced $800-$999k. The tightest segments in active inventory are mid-priced and lower priced properties. That tight inventory is limiting sales. There are currently 7 homes under contract that are priced under $800k.
Waterfront lot sales are benefitting from low home inventory, as buyers unable to find ready waterfront homes shift their focus to building. Here’s something interesting: Of the waterfront lots that closed in January, half had been on the market for under five weeks, and two had been on the market for 3-4 YEARS. So average time on market if pretty meaningless! We noted that throughout last year’s lot sales; quite a few lots that had been on the market for years finally sold!
Here’s a closer look at waterfront lot sales since January 2017:
- Belmont, 31 lots, average price $224,000
- Reflection Pointe (in Belmont), 14 lots, average price $154,000
- McLean (in Belmont), 5 lots, average price $432,000
- Lake Wylie (Clover School Distr.), 24 lots, average price $280,000
- Charlotte, 17 lots, average price $317,000
- Rock Hill, 3 lots, average $287,000
- Tega Cay/Fort Mill, 3 lots, average $370,000
Reflection Pointe in Belmont still has a number of dockable waterfront lots selling for less than $150,000. This development was hardest hit by the recession, and slowest to recover. Meanwhile, just down the road in McLean, lots are commanding premium prices. Woodland Bay and choice main channel lots are also yielding prices over $300,000.
In Lake Wylie, properties go up in price as the location gets closer to the Buster Boyd Bridge. Handsmill on Lake Wylie is also beginning to sell well. There have been lots on the southern end of the lake, around Allison Creek, selling above $300,000, but similar lots in the 29710 zip code generally sell for 10-15% higher.
Good news for sellers of waterfront cabins! Average sale prices have been on the rise for the past few years. Take a look:
Waterfront cabin sales on Lake Wylie, Average Price by Year
2013 – $311,000
2014 – $355,000
2015 – $355,000
2016 – $364,000
2017 – $386,000
The price for waterfront cabins is impacted by the buyer’s planned use for the property. If they plan to remove the cabin and build a permanent home, the presence of the cabin can be seen as a negative. But often a buyer wants to enjoy the cabin as it is, prior to building or as a second home indefinitely. Cabins that are neat and in good condition command a premium price.
If you’d like to see more data on recent sales, visit The Lake Wylie Man Waterfront Market Sales Report for 2017. The Lake Wylie Man is the leader in waterfront sales on Lake Wylie. Rely on the market expert for buying or selling waterfront real estate!
Waterfront Sales Update – Fall 2017
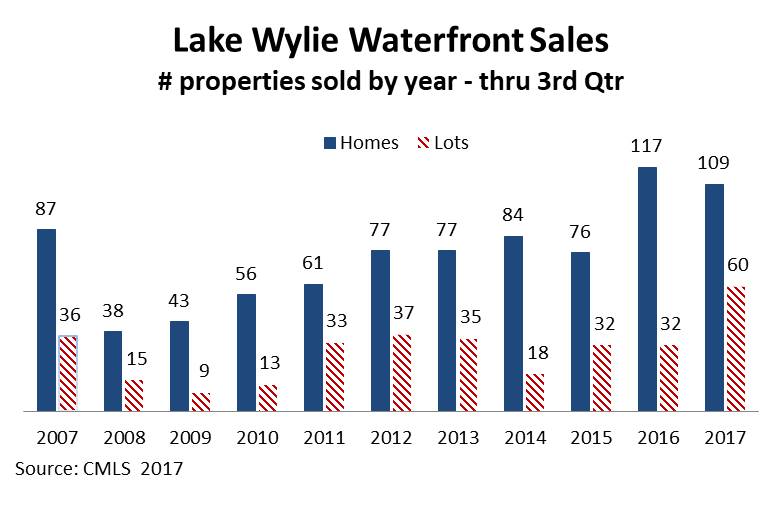
It has been nice to have a little chill in the air this week, a sure sign that fall is on its way. There were a dozen waterfront home closings in September, down from last year’s record setting level of 18. We’re now lagging in closings by 7 homes vs last year, but still posting some very positive market trends. In addition, waterfront LOT sales are at an all time high, with 56 closings to date. That is more than the year end number for any year in the past decade!
Here are some highlights for this year’s waterfront market:
• Average waterfront home sales price is $712,000 – highest since 2008!
• Average time on market for waterfront homes is just 144 days, fastest since 2007
• Average WF home sales price is 93% of the original price, best performance in over a decade
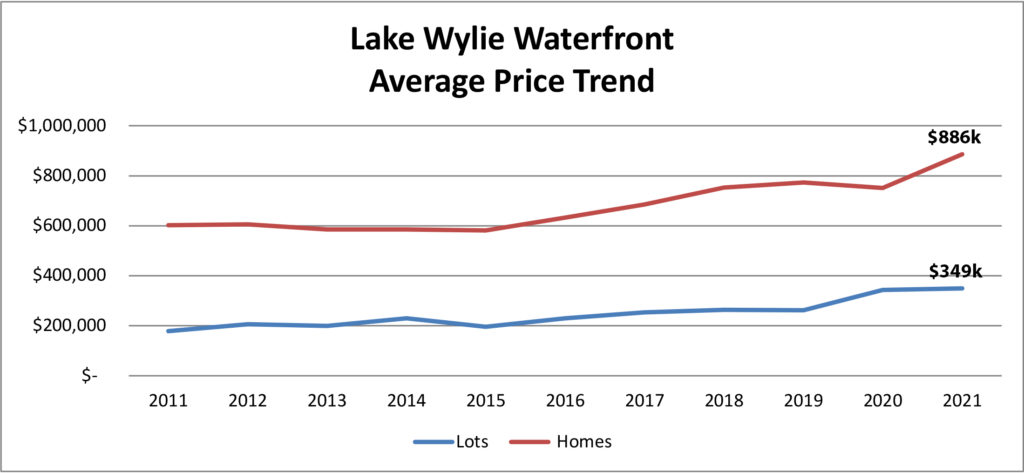
• Waterfront lot sales prices average $254k, highest since 2010.
• Number of waterfront lot sales is the highest in over a decade
• Twenty percent of waterfront lots sold so far this year had time on market in excess of 1,000 days. Some “old” inventory is beginning to clear out.
• Listings are at a low point, both for waterfront lots and waterfront homes. Lack of inventory is affecting market dynamics significantly.
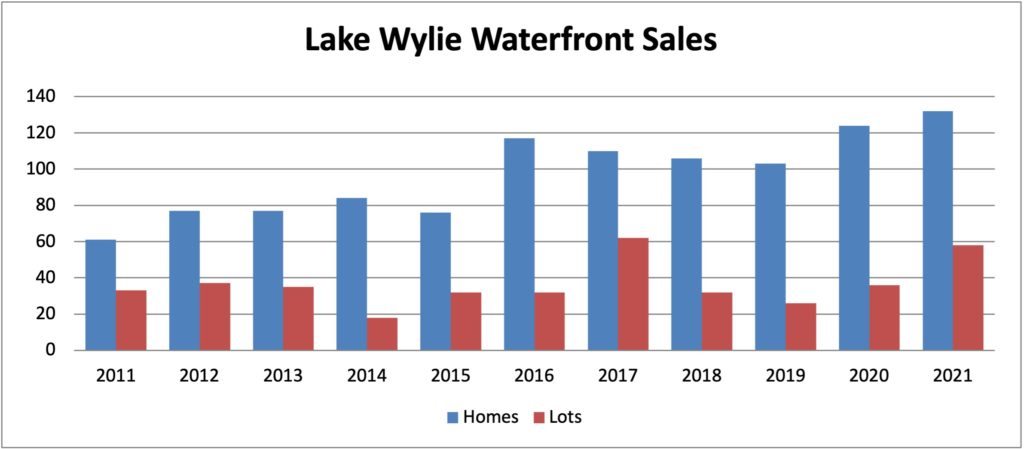
Waterfront Sales trend over time:
The solid blue bar represents number of waterfront home sales through 3rd quarter of each year. The red striped bar represents waterfront lot sales. While 2016 hit record levels for home sales, 2017 performance follows closely behind. If it weren’t for the shortages in inventory (number of listings available), I feel sure that this year’s performance would surpass last year’s. In DOLLAR sales, however, 2017 is ahead of last year and is at record levels, with $76.5 million in total waterfront home market sales. That’s about 8% above last year.
Waterfront LOT sales are at record numbers, with 60 lots closed to date, and 11 currently under contract. Average price of waterfront lot sold on Lake Wylie this year is $254k, the highest since 2010 and a 12% improvement over last year. Lot sales by area:
•21 lots in Belmont, averaging $186k. Highest priced lot in Belmont was $500k, in McLean. Lot sales in Reflection Pointe brought the average price down, with 13 lots sold at an average of $154k.
•18 lots in the Clover School District, averaging $290k.
•134 lots sold in Charlotte, average price $308k. Three sales in The Sanctuary (or adjacent), plus a couple of premium priced lots in The Palisades area brought the average sales price up.
•2 lots in Rock Hill (average price $285k), and 2 lots in Tega Cay ($337 average price.)
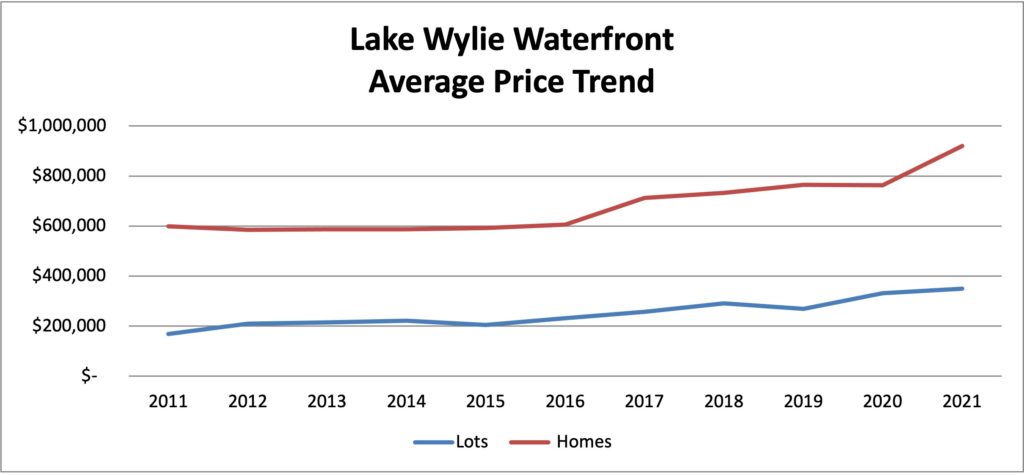
Sales price trend is as follows: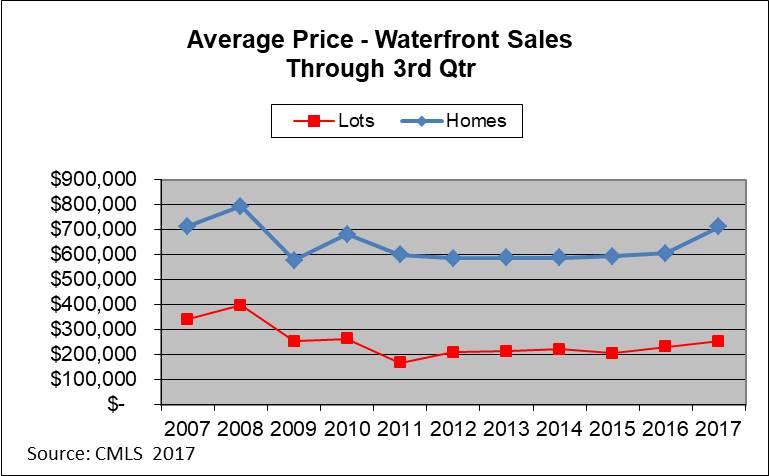
The blue bar (on top) represents sales price for waterfront homes, through 3rd quarter of each year. The red (bottom) line is average sales price for lots. After several years of “flat” performance, the average prices are ticking upward. This doesn’t necessarily translate to price increases on individual properties, however. Rather, the average price is driven more by the mix of properties purchased. This year, we’ve seen RECORD LEVEL sales of $1 million plus homes, and have seen an increase in PREMIUM waterfront lots.
McLean homes and lots represent a premium priced waterfront development, however its impact has not been significant yet. The higher priced lot sales are scattered all over the lake: Handsmill in York, The Sanctuary and The Palisades in Charlotte, Woodland Bay, Reflection Pointe and McLean in Belmont, Fort Mill/Tega Cay, Allison Creek, Concord Road. As home inventory tightened up, buyers turned to waterfront lots to build their own homes rather than buy established.
Million-plus dollar home sales were scattered around the lake as well: a couple in McLean, a few more in Belmont, York, Tega Cay, quite a few in “non-neighborhoods.” In addition to the 16 homes sold to date in the $1 million category, there are 11 currently under contract. Four of these are new construction (McLean), and may not close in this calendar year, depending on completion schedule. In 2016, there were 15 sales in this price segment for the entire year, so already we’re significantly ahead of last year’s record breaking numbers.
New homes in The Vineyards on Lake Wylie (upper lake area) have several sales in the $800’s and $900’s, newer construction homes not found in abundance on the southern part of the lake.
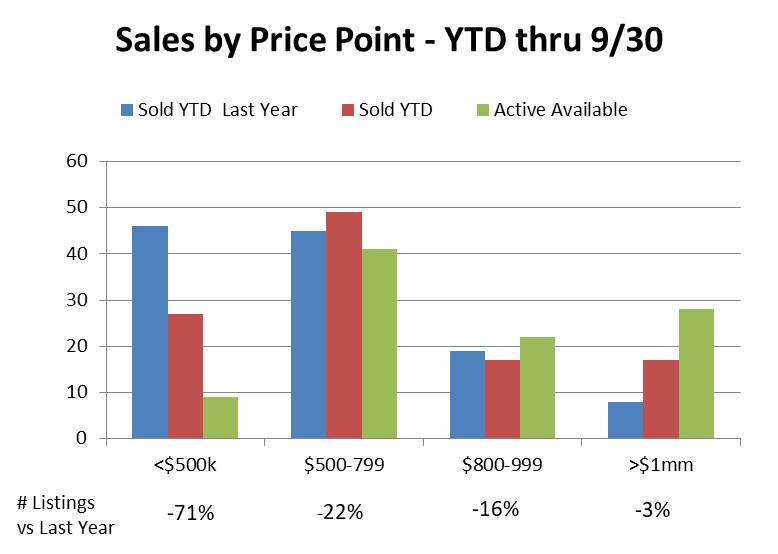
Waterfront Homes by Price Point:
In the chart above the blue bar represents last year’s sales through 3rd quarter, and the red bar represents number of waterfront homes sold this year. Sales surpass last year most significantly in the $1 million plus segment, followed by homes in the $500-$799k segment.
The GREEN bar represents number of homes currently listed in each price segment, and the percentage differences below the chart depict listings vs. last year. The most dramatic story is in the lower priced homes, where there are just 9 homes currently listed (including some under contract!). Stacked up against “demand,” more accurately represented by last year’s sales, you can see that the decline in sales for homes under $500k can be blamed on lack of inventory, which is about 71% lower than it was last year!
Inventory in the $500-$799k segment is down 22% vs last year, and sales for this year show a modest increase over last year’s, in spite of the inventory shortage.
Inventory in the $800-$999 price range is probably the “healthiest,” with a good number of choices relative to the number of buyers. In the $1mm+ segment, homes available still outweigh demand, but with the increase in demand in this price category, the outlook is improving over what we’ve seen in recent years. There have been quite a few new listings in this segment, and more than a third of this year’s sales have occurred with homes on the market less than 2 months.
If you’d like to see more details about recent home and lot sales, please visit my webpages for home sales:https://thelakewylieman.com/waterfront-home-sales
and recent lot sales: https://thelakewylieman.com/recentlysoldlots
As always, I welcome your calls and emails to discuss your property in more detail. Thanks!
Check out my website for Lake Wylie real estate. We specialize in Lake Wylie waterfront homes and land.
Development Update – Fall 2017
As the heat of summer begins to subside and we settle into our fall routines, the real estate market generally begins to slow down a little. This year, however, the bullish market is still blazing!
Lake Wylie waterfront home listing inventory is at record low levels, particularly in the mid- and lower-priced ranges. This is having a profound impact on the market. Waterfront homes are selling at a much faster rate, at an average of four months on market, compared to about six months in 2016. Sellers are also seeing offers closer to their asking price, and the average waterfront home sale is about $687,000, up 14% from 2014.
Increased demand for quality homes is motivating buyers to stay on top of new listings. Since May, over half of waterfront homes sold were on the market for less than a month! While most of these quick sales were in the moderate price waterfront segment ($500,000 – $800,000), several were in higher priced, “luxury” segments. As true in recent years, inventory levels in the million-dollar plus price range is still much higher than demand levels. However, buyers in this category often have specific criteria, and when a new listing meets those criteria, they are ready to buy.
What is selling on the lake?
In reviewing sales from the current year, along with what is currently under contract, we can get an idea of what is driving today’s buyers. Sales have occurred all around the lake, with 70% on the South Carolina side. Almost half of sales (45%) were in the Clover School District.
Waterfront homes in the 500K and under price point average about 40 years in age. More than half of these sales went under contract in under two months. Current inventory is less than 25% of last year’s levels, the most pronounced shortage of any price segment.
In the $500,000 to $1 million category, the median age of sold homes is 24 years, with average time on market about four months. While the current inventory is higher in this price point, it still demonstrates a deficit with about 30% less than last year this time.
Homes over $1mm are selling at record levels, with ten homes sold in this luxury price segment through the end of July.
Waterfront lot sales are outpacing last year’s by about 30%, quite likely a result of some buyers deciding to build their home after being unable to find an existing property that met their needs.
Market Trends Off the Lake
In general, the market is very strong within the Clover School District. The median home price off the lake is $283,000, up a little from a year ago. Homes in the Clover School District spent an average of ten weeks on the market. The excellent Clover School District remains a strong selling point, motivating buyers to make strong offers. In fact, sellers are receiving an average of 98% of their asking prices, which is a slight increase from 2016. Almost a third of home sales off the lake this year have been new construction.
The little haven of Lake Wylie is an attractive place to live with great schools, low taxes and plenty of southern charm. Because of this, expect the housing market to remain strong and lead us to another record breaking year.
Drew Choate, “The Lake Wylie Man” specializes in Lake Wylie waterfront homes and lots, and other homes in the Lake Wylie community. He is affiliated with Wilkinson ERA Real Estate and has an office in Lake Wylie.

