In a time where the market is bullish, the number of Lake Wylie waterfront home sales in 2017 actually dropped 12% vs. 2016. Consider this: NON-waterfront home sales rose 6% in York County, 19% in Belmont, and 17% in the southern Charlotte (zip code 28278) area, in comparison to prior year sales.
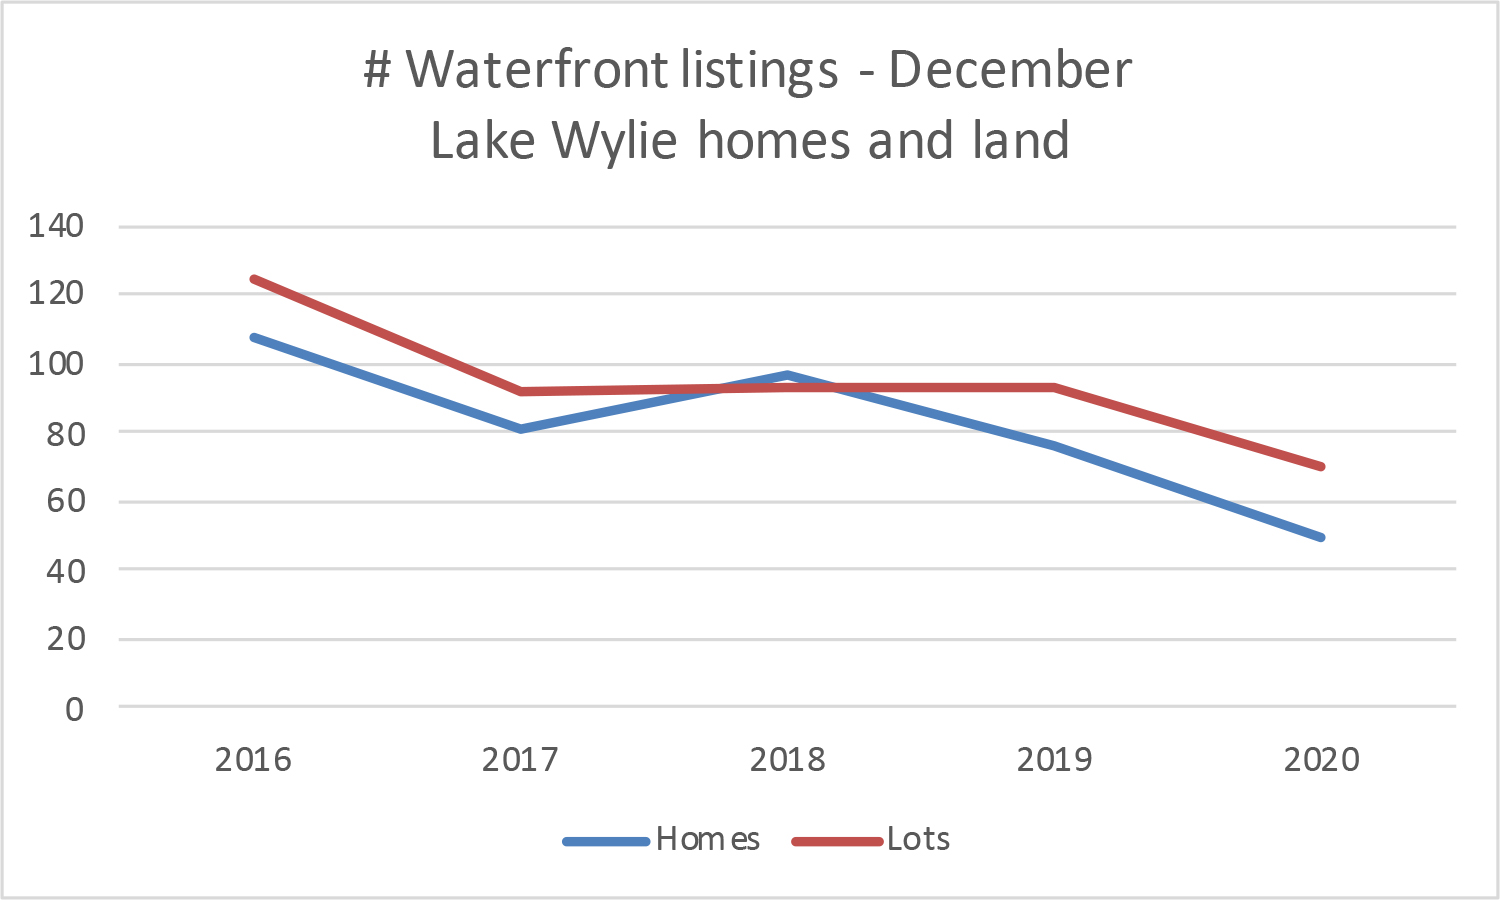
Of course, we know the culprit for the lackluster waterfront performance: LACK OF INVENTORY FOR SALE. Number of waterfront homes for sale have been steadily declining over the past few years, but in 2017, we dropped to record lows. Demand far exceeds supply, especially in the lower and mid-price categories.
As a result, we’re seeing classic economic consequences. Prices are edging up, particularly in those low-to-mid priced properties. Time on the market is shorter, which many properties being snatched up in the first few weeks on the market, and at full (or close to it) asking price. Waterfront lot sales are at a record high, with many buyers turning to building their own home, instead of waiting for one to come on the market that meets their criteria. Overall, it is a great time to be a seller, indeed!
Let’s take a look at some of the year’s highlights:
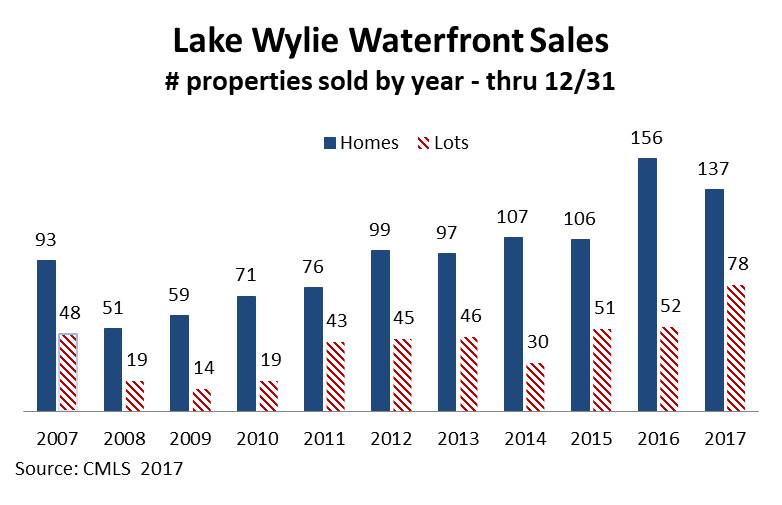
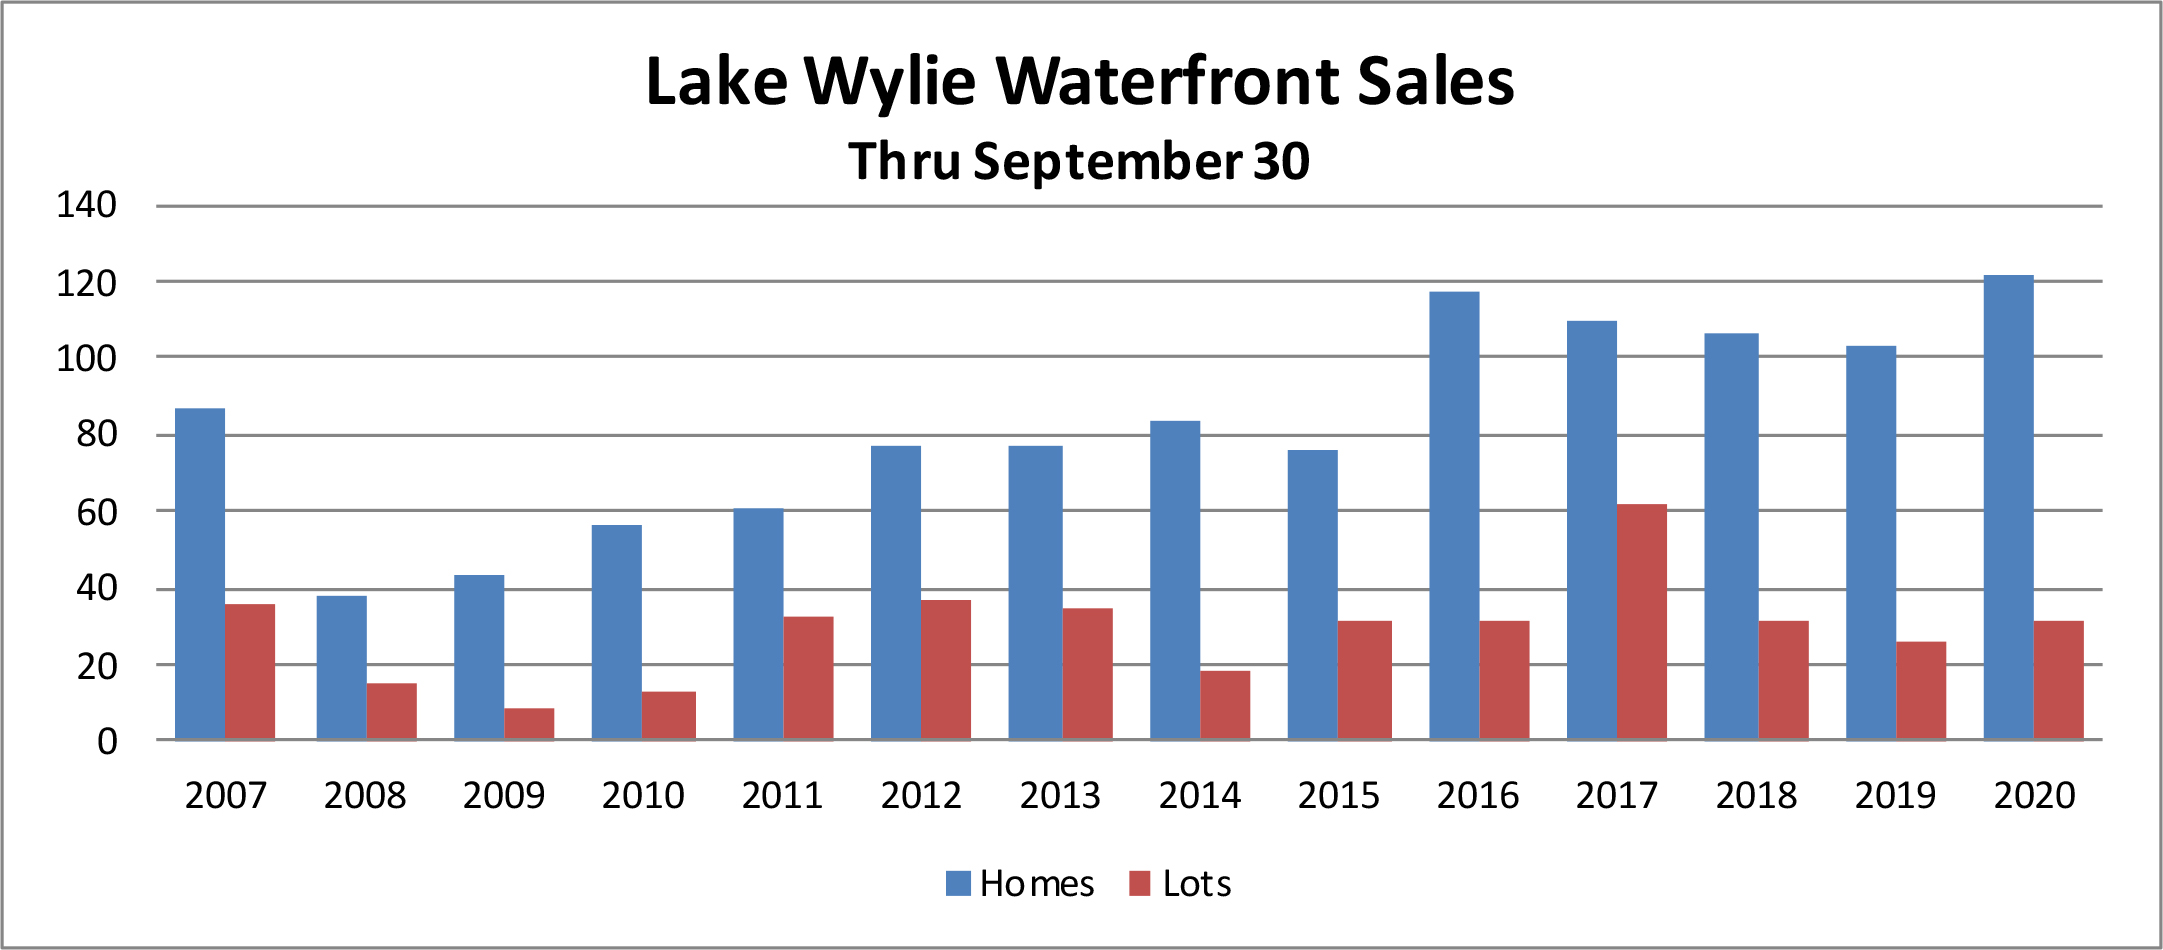
In the chart above, the blue solid bar represents number of waterfront homes sold by year, and the red striped bars are number of waterfront lots. In 2017, number of homes sold dropped by 19 (12%), and number of lots sold increased by 26 (50%) vs. prior year. Waterfront lot sales are at RECORD LEVELS this year.
Even though we’re showing decreases in home sales in comparison to last year, however, sales are up significantly in comparison to sales since the market “recovery” beginning in 2012, and well above the sales level before the recession. We’ve been lucky this year with the weather, without a drought affecting the lake levels.
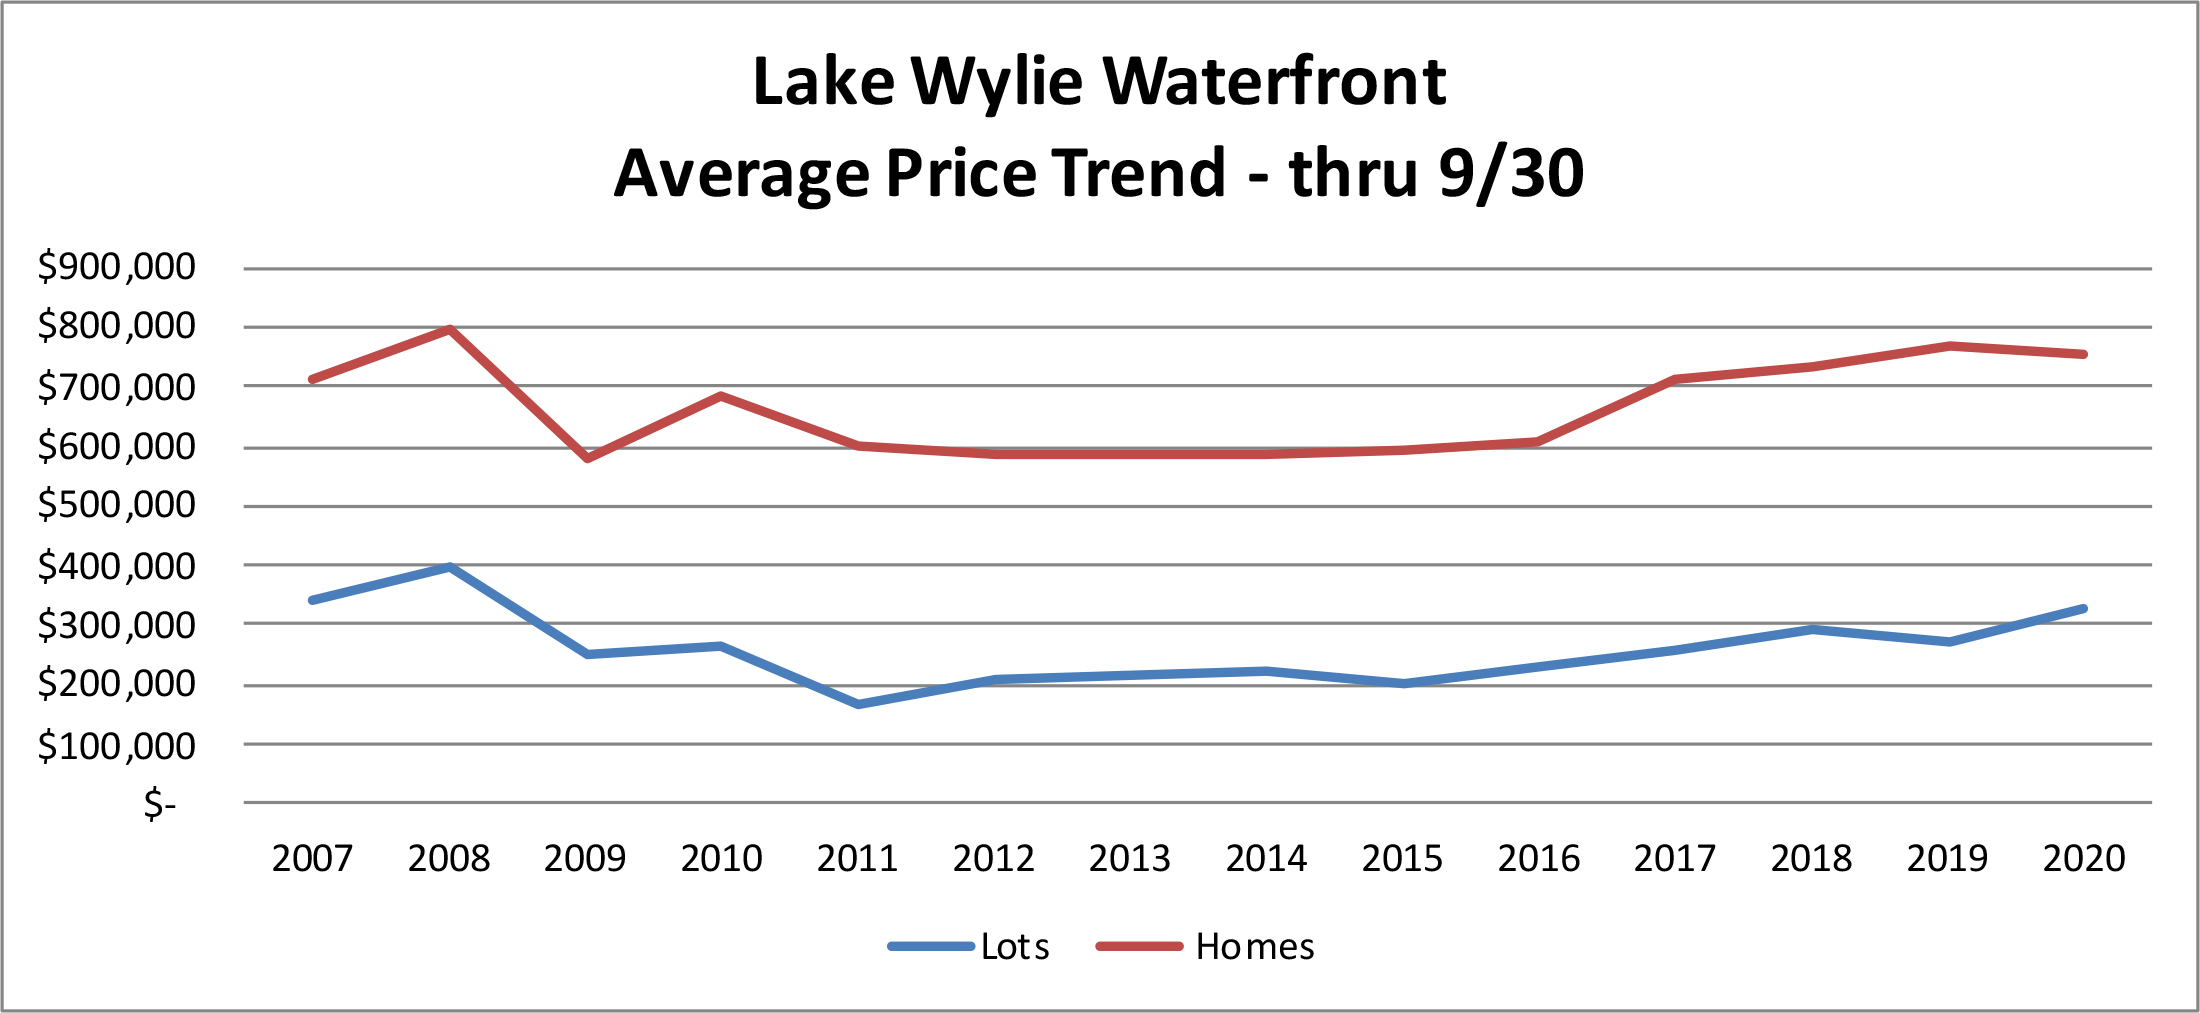
Average sales prices are up for both waterfront lots and homes:
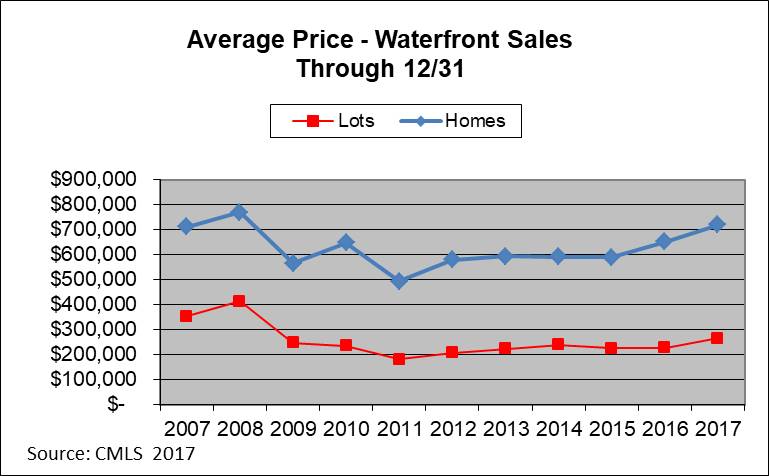
In the chart above, average sales prices for waterfront homes are shown on the blue line, and waterfront lot prices are shown on the red line. In 2017, the average WF home sale was $720k, the highest price achieved since 2008. In comparison to last year, the average home price increased 10% and the average lot sales price increased 17%. Does that mean you can immediately post a price increase on your property? Not necessarily.
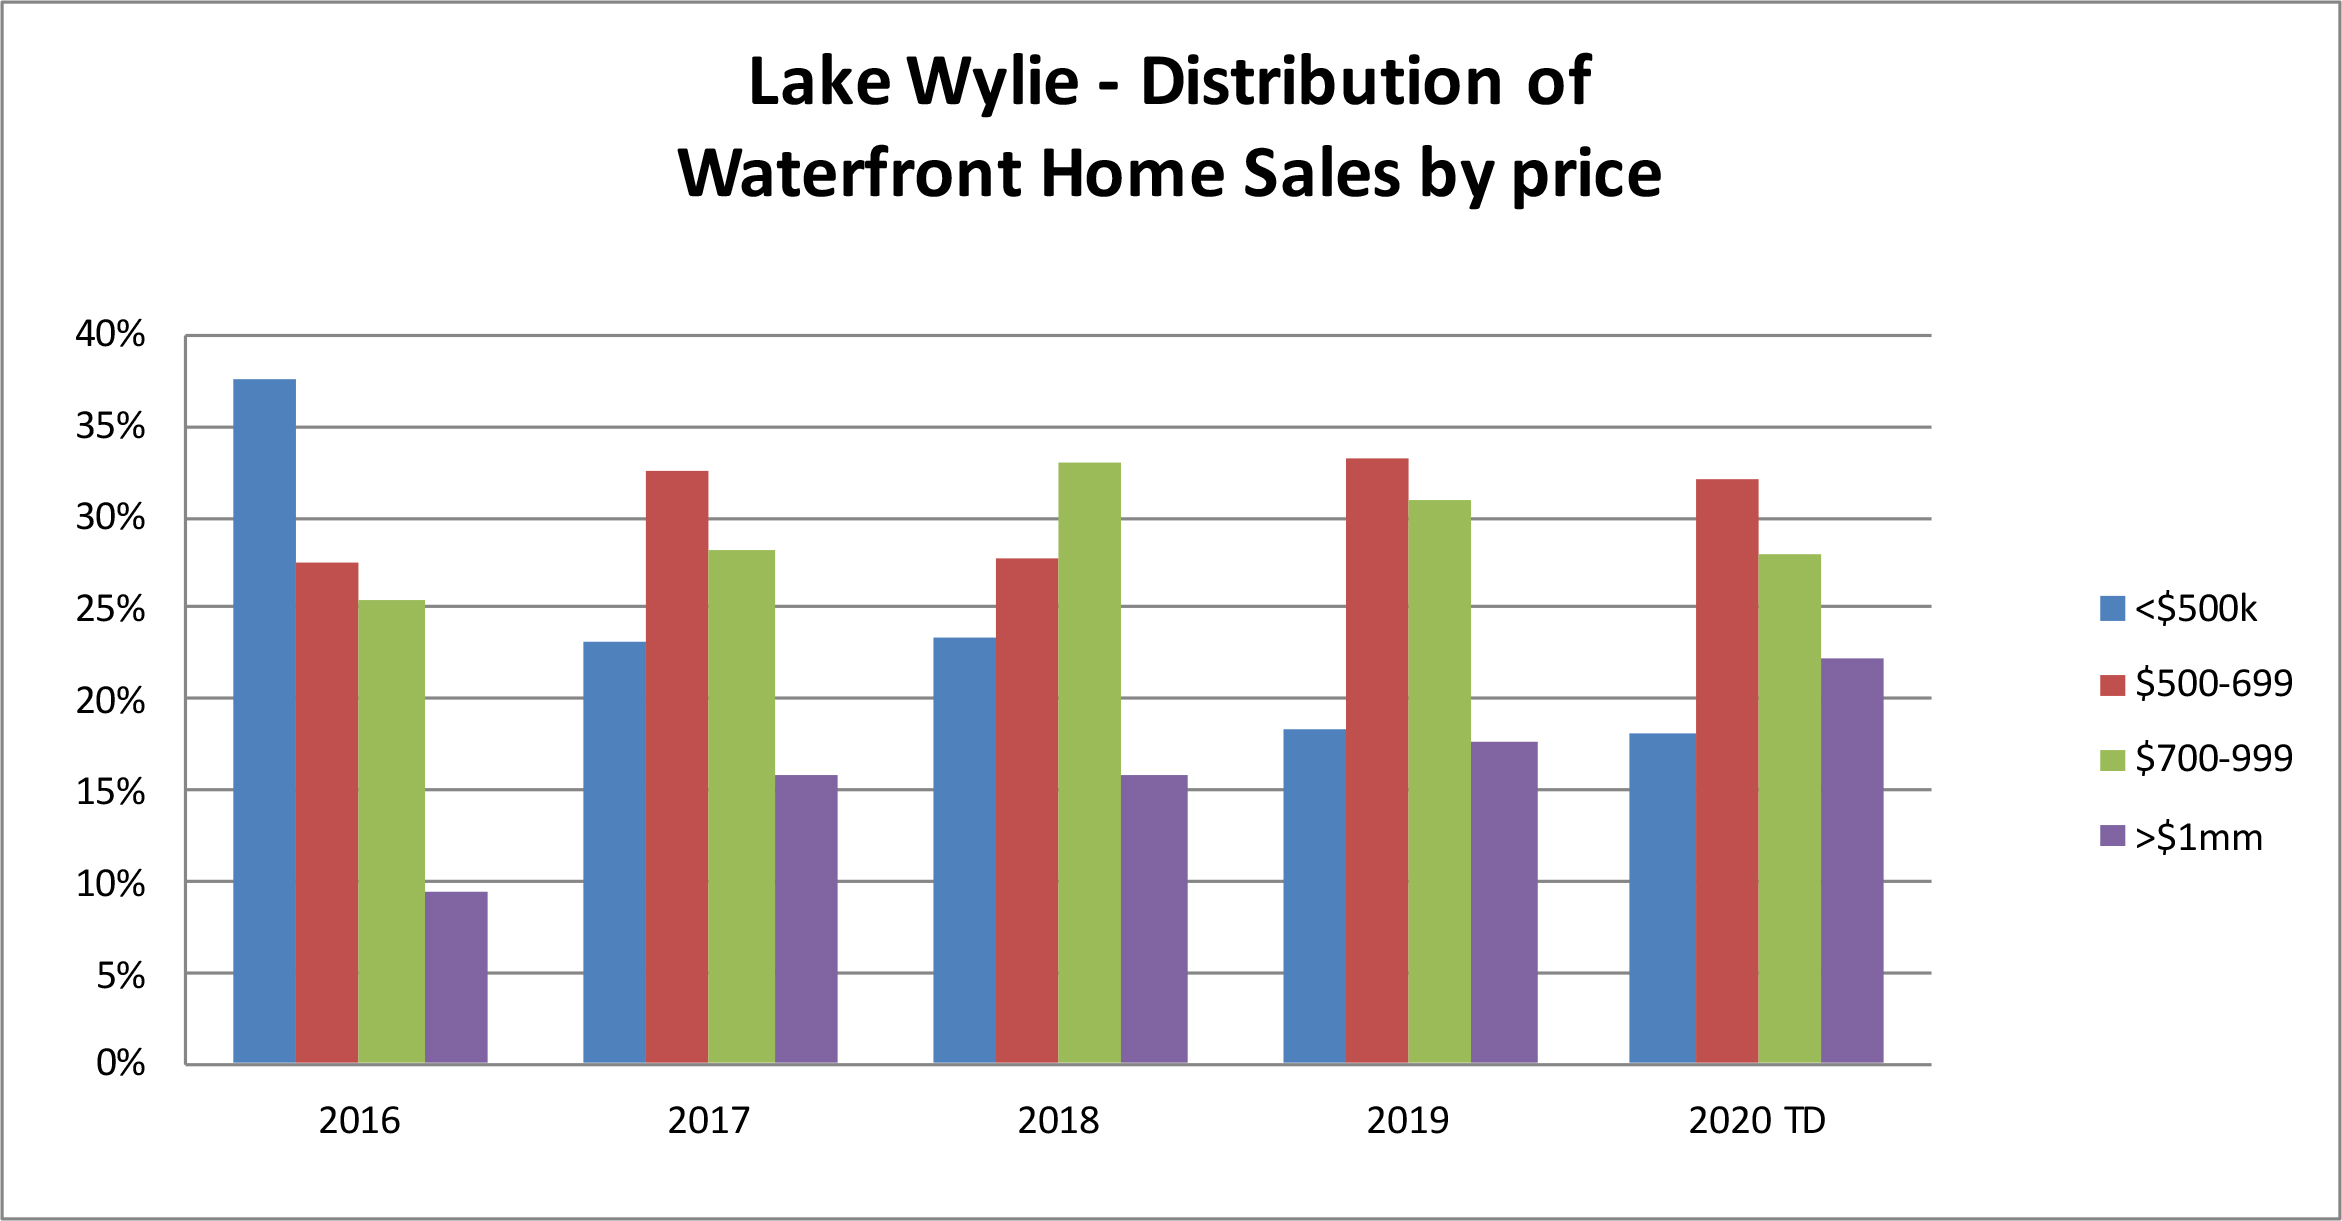
Most of the price increases were due to a shift in the mix of properties sold. In 2017, the market had a record number of sales of $1mm+ homes (a total of 22!). At the same time, the lower priced home sales were way off due to inventory shortages. See chart below:
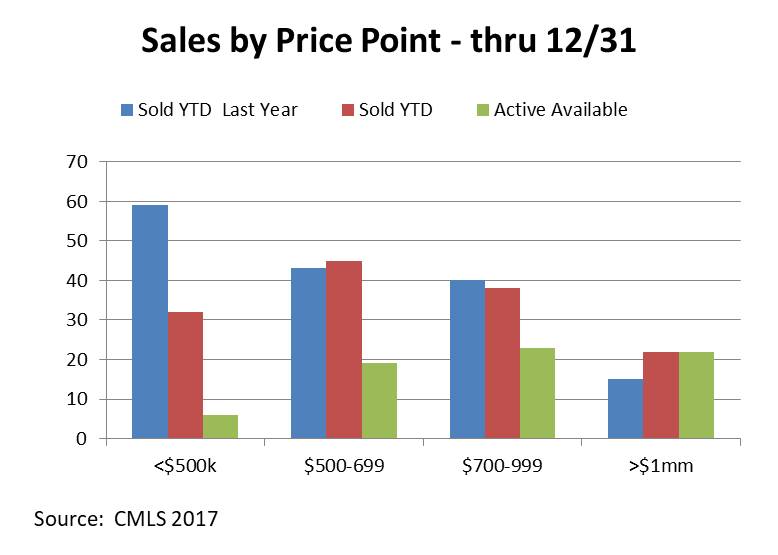
In the chart above, the blue bar represents 2016 waterfront home sales, the red represents number of homes sold in 2017, and the green represents current listings (as of the first week of January 2018).
Sales in the lowest price segment were down by almost HALF, and this is the category responsible for the downturn in total waterfront home sales in 2017. There are currently just six waterfront homes listed for under $500k, which makes a huge impact considering that this has traditionally been one of the strongest segments. (In some years, the $500-$699k segment has been first.) In this lowest priced segment, most of the homes are older (average age is 40), and smaller (average square footage is just under 1900 square feet.) Older homes in Tega Cay, cabins/weekender homes, and modest styled homes around the lake comprise this segment. Due to the shortage in inventory, sales have occurred quickly, with 44% of sales in this segment occurring within the first month of listing. Sellers in this category can be a little more aggressive with their pricing, asking 10-15% more than they would have a couple of years ago, depending on condition and location.
Inventory is also fairly tight in the $500-$699 segment, usually the top or second top selling category on the lake. 2017 sales were up by two houses over 2016. Homes in this segment averaged 30 years in age, about 3175 square feet in size. Average prices in this segment were very consistent with the previous year, and average time on market was about four months. About 42% of sales in this segment were on the market for less than a month. If homes are move-in ready and offer a strong location on the lake, sellers can expect a modest price improvement (5%) over recent years.
Homes in the $700-$999k price segment averaged about 19 years old, 4200 square feet. The Clover school district and south Charlotte area are by far the leaders in this home category. These homes do take a little longer to sell, with time on market averaging about 5 months, with 29% on the market for less than a month. Inventory levels (homes for sale) have held steady over the past few years, and are at the most favorable levels relative to sales. Supply is sufficient for demand. New listings are needed to replace homes that are sold, of course, but this segment is in the best shape, balanced between sellers and buyers. Therefore, sellers need to be pay particular attention to condition of home, marketing and staging, curb appeal, and competitive pricing to make sure buyers choose their homes over others.
Homes over $1mm have shown the most dramatic increase in sales, with 22 sales (compared to a record setting 15 last year, and 8 in 2015.) Historically, this segment has had inventory exceeding sales, sometimes with up to a 5 year “supply.” With the record setting sales this year and last, some of that inventory has worked its way through the system. While there is still an “oversupply” of listings relative to sales, the picture is much more positive for sellers than in recent years. Average time on market for homes sold $1mm plus was about 6.5 months this year, with 18% of the sales having time on market of less than a month. Home sales in this segment were pretty evenly spread between the Clover school district, Fort Mill/Tega Cay, Charlotte and Belmont. Average age of homes sold in this category was about 15 years in 2017, with about 5650 square feet. New construction, particularly in McLean, played a role in improving the price for this category. Established homes, however, need to be competitively priced and offer a “Wow!” factor in order to gain attention above the competition: Extraordinary location/views, outdoor features such as pools/outside kitchens/fireplaces, gourmet kitchens, and excellent move-in ready conditions.
With properties moving so quickly, especially in the low-and-mid-priced segments, sellers should expect buyer interest “right out of the gate.” If there is no strong interest within the first couple of months, sellers should be prepared to make adjustments on price or make improvements, according to showing feedback.
Waterfront Lots sold at RECORD LEVELS in 2017. Here is the breakdown by price:
Under $200k – 22 lots – most in Belmont. Down from 28 sales in 2016.
$200-$299k – 25 lots – most in Clover school district and Charlotte. Up from 15 sales in 2017.
$300-$400k – 22 sales , up from just 7 in 2016. A few “premium” lots in Belmont, plus Charlotte and Clover school district.
Over $400 – 9 sales, up from 4 sales in 2016. A few in McLean, , a couple in The Sanctuary, premium sales in Tega Cay, The Palisades
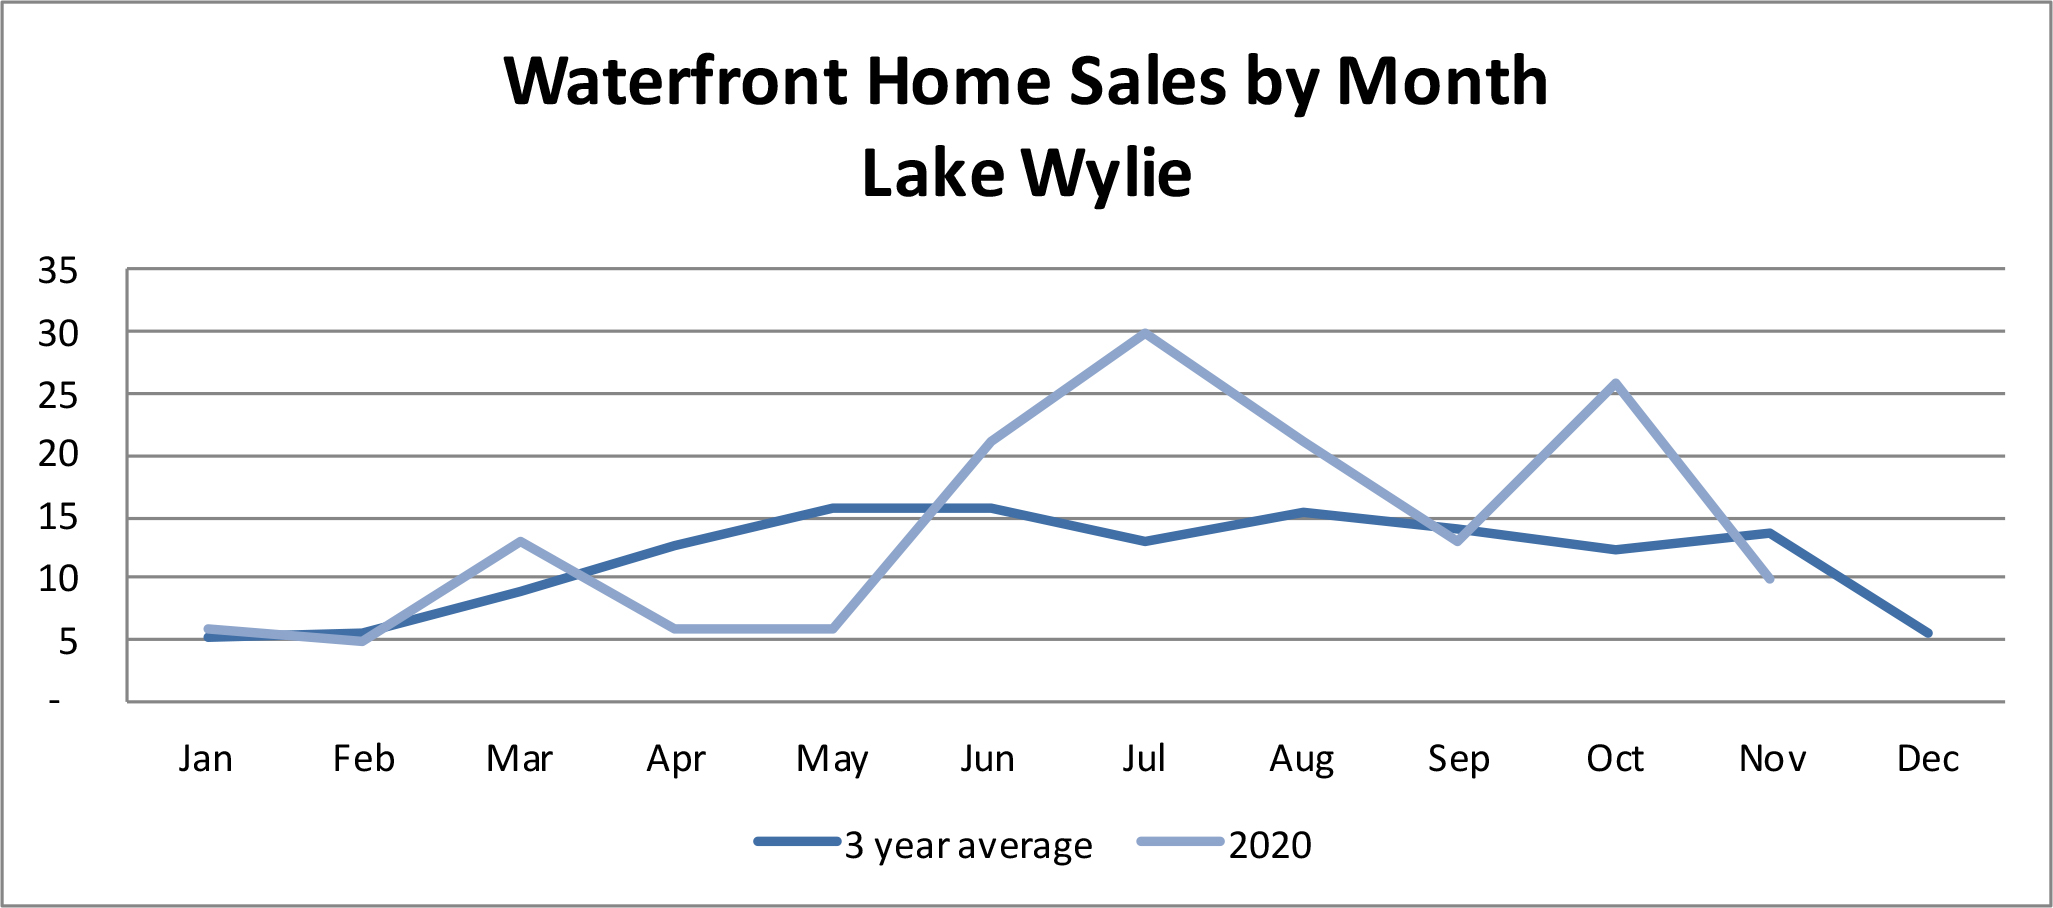
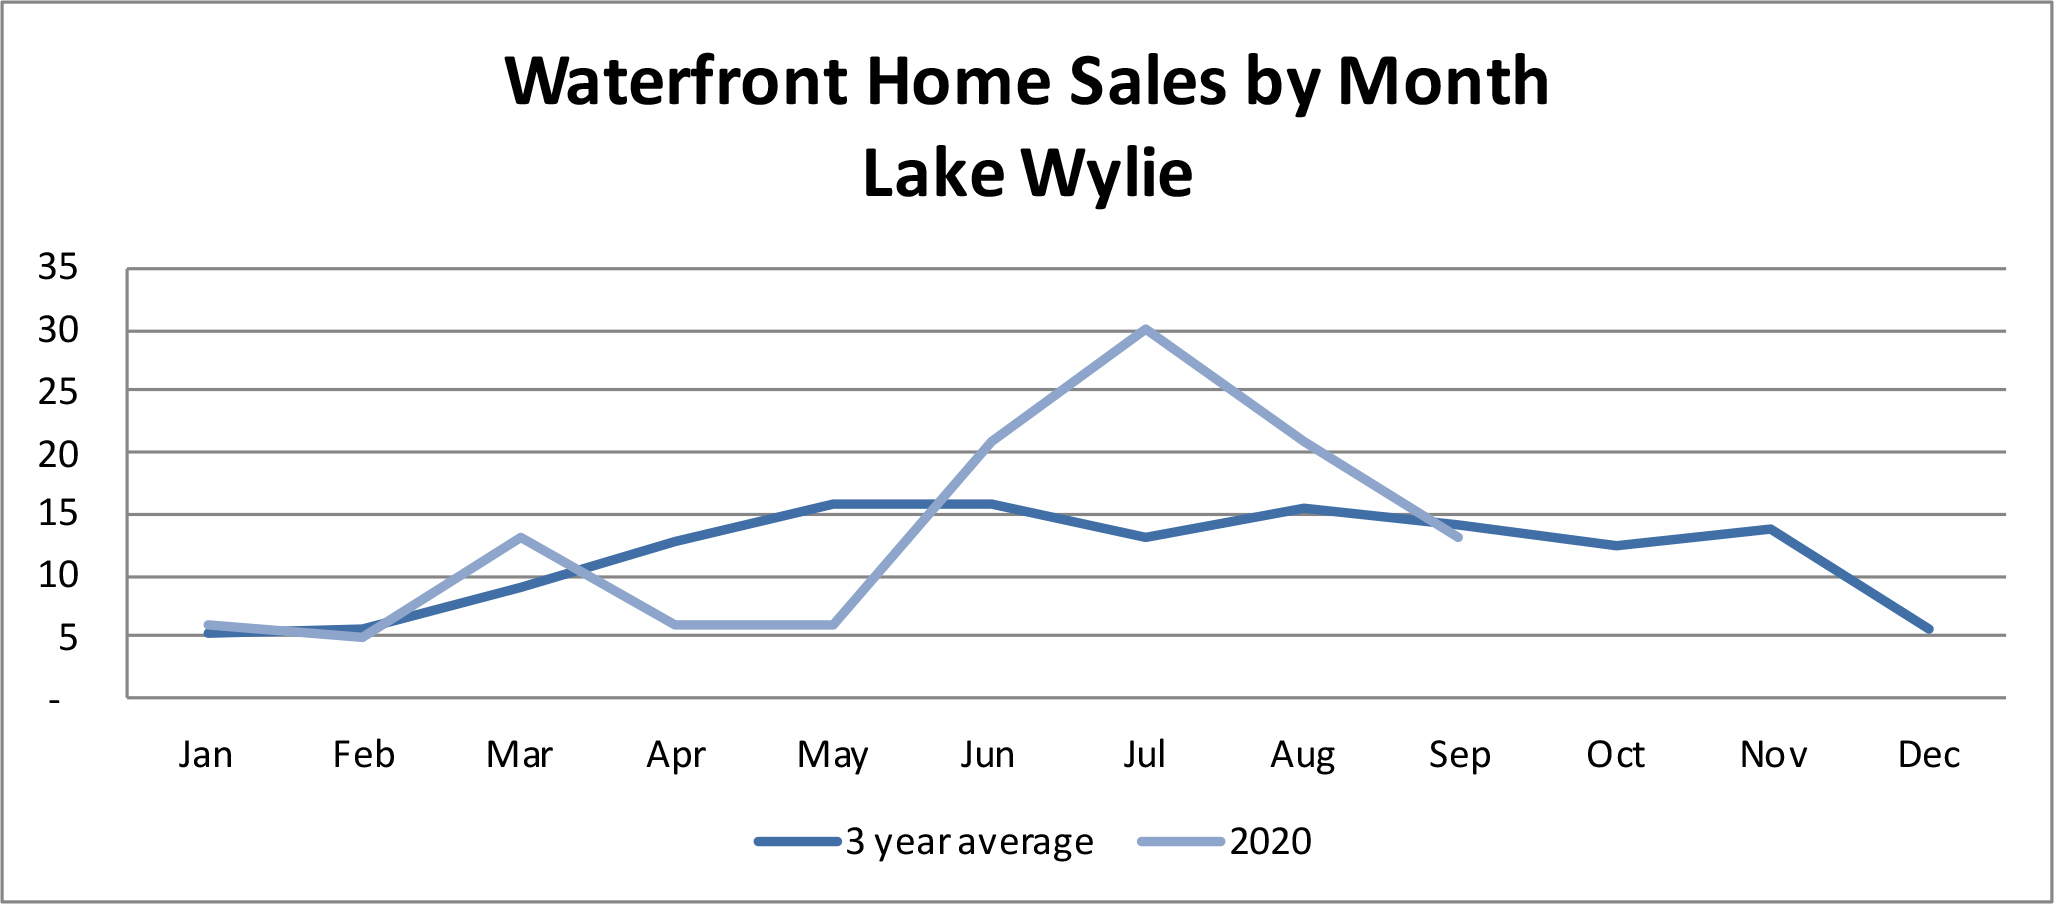
If you’re considering selling your home in 2018, when should you put it on the market? Below is an average for the last three years, closings by month. Keep in mind that most homes “close” about 6 weeks – 2 months after a contract is written, so if the closings peak in May, then most likely those homes went under contract in March.
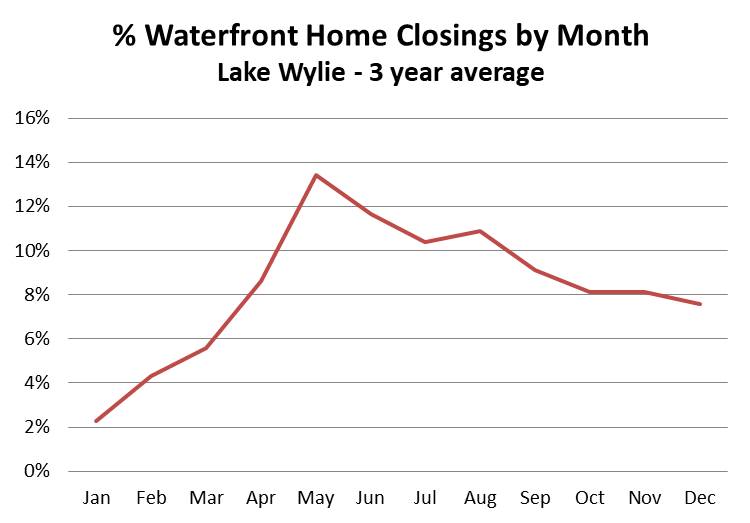
January and February historically have the lowest number of closings each year (November/December sales.) March/April picks up considerably, and closings peak in May through August. NOW IS THE TIME to start getting ready to list your home. Talk to the experts (that would be The Lake Wylie Man, of course) for the most knowledgable advice in pricing and marketing. Once again, The Lake Wylie Man outsold all other realtors on Lake Wylie – – with THREE TIMES the number of sales in comparison to the next highest selling waterfront realtor in the market. For the past decade, The Lake Wylie Man has led the market by a huge margin. That’s not luck – – that’s experience, marketing, and solid customer service.
For details about recent waterfront sales, please visit my webpage: Recent Lake Wylie Home Sales or Recent Lake Wylie Lot Sales. I look forward to talking with you about YOUR property.