Greetings! I hope this newsletter finds you safe and doing well, particularly after last week’s storms.
The hurricane put the brakes on real estate activity at the end of the month, delaying a few closings and pausing showings as we all dealt with power outages and storm clean-up.
Still, September closed out strong, with year-to-date performance on Lake Wylie showing significant gains over last year. Improvements in inventory levels and declining mortgage rates have helped to fuel the market.
Compared to last year, dockable waterfront home sales are up 25%, and lot sales have almost tripled:
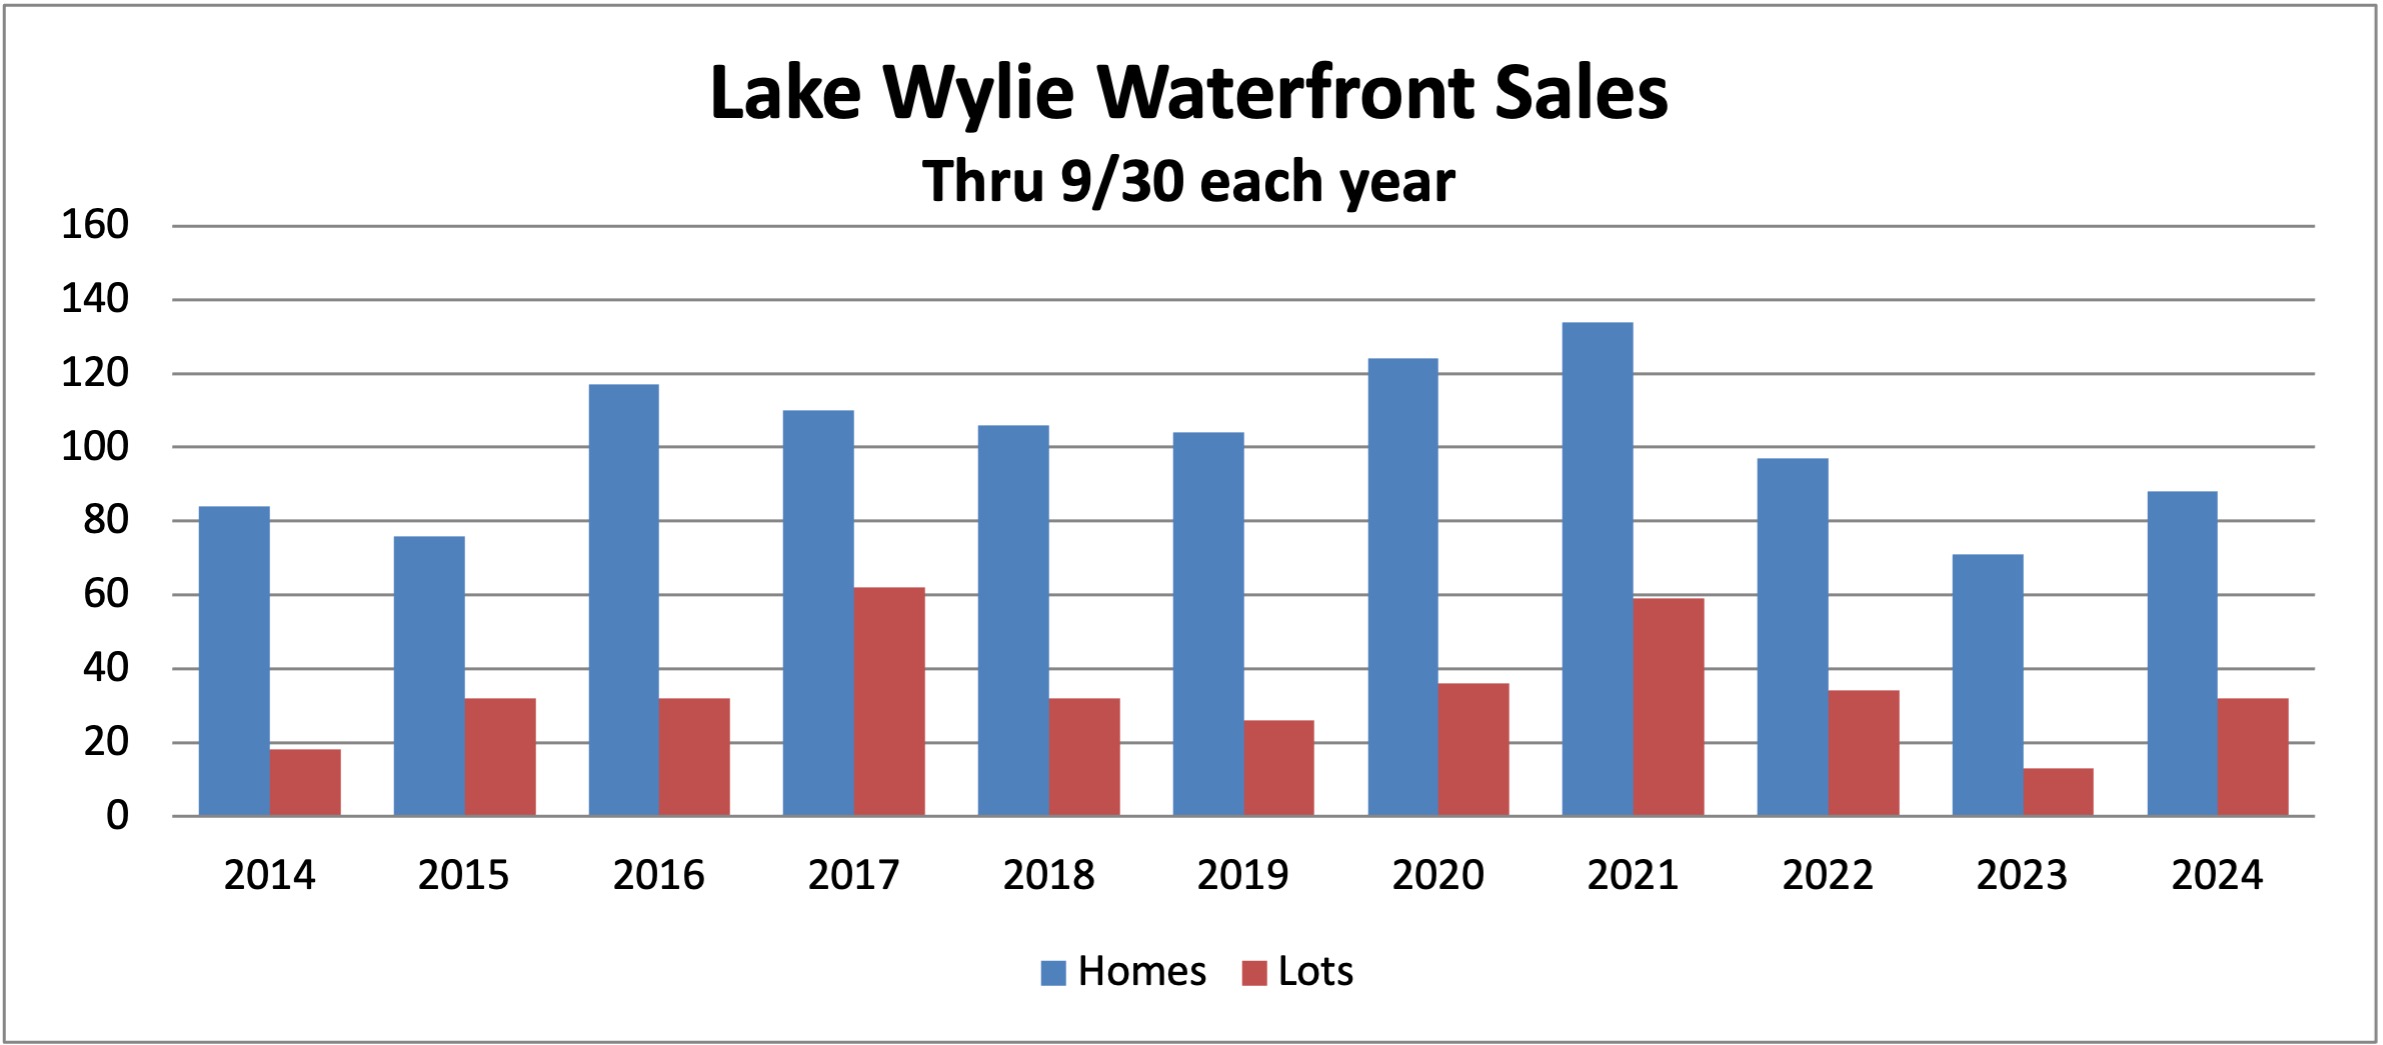
In the chart above, the blue bars represent the number of dockable waterfront homes sold on Lake Wylie through the third quarter of each year. The red bars represent the number of dockable lots sold.
Sales peaked in 2021 as the COVID-19 pandemic spurred population growth and real estate demand in our area. Dwindling inventory of available houses caused a decline in sales in 2022-2023, along with significant price increases. The shortage in housing for sale began to ease this year, though inventory levels are still down by about half of pre-pandemic norms.
Dockable lot inventory, on the other hand, has not recovered. It is at its lowest level in the past 15+ years for this time of year, with just 25 lots listed for sale on the lake. Over half of the available lots are in Belmont, about one-fourth are in Charlotte, and the remaining fourth are in Lake Wylie, Rock Hill and York.
The shortage in inventory, coupled with high demand, over the past few years has contributed to price increases on the lake:
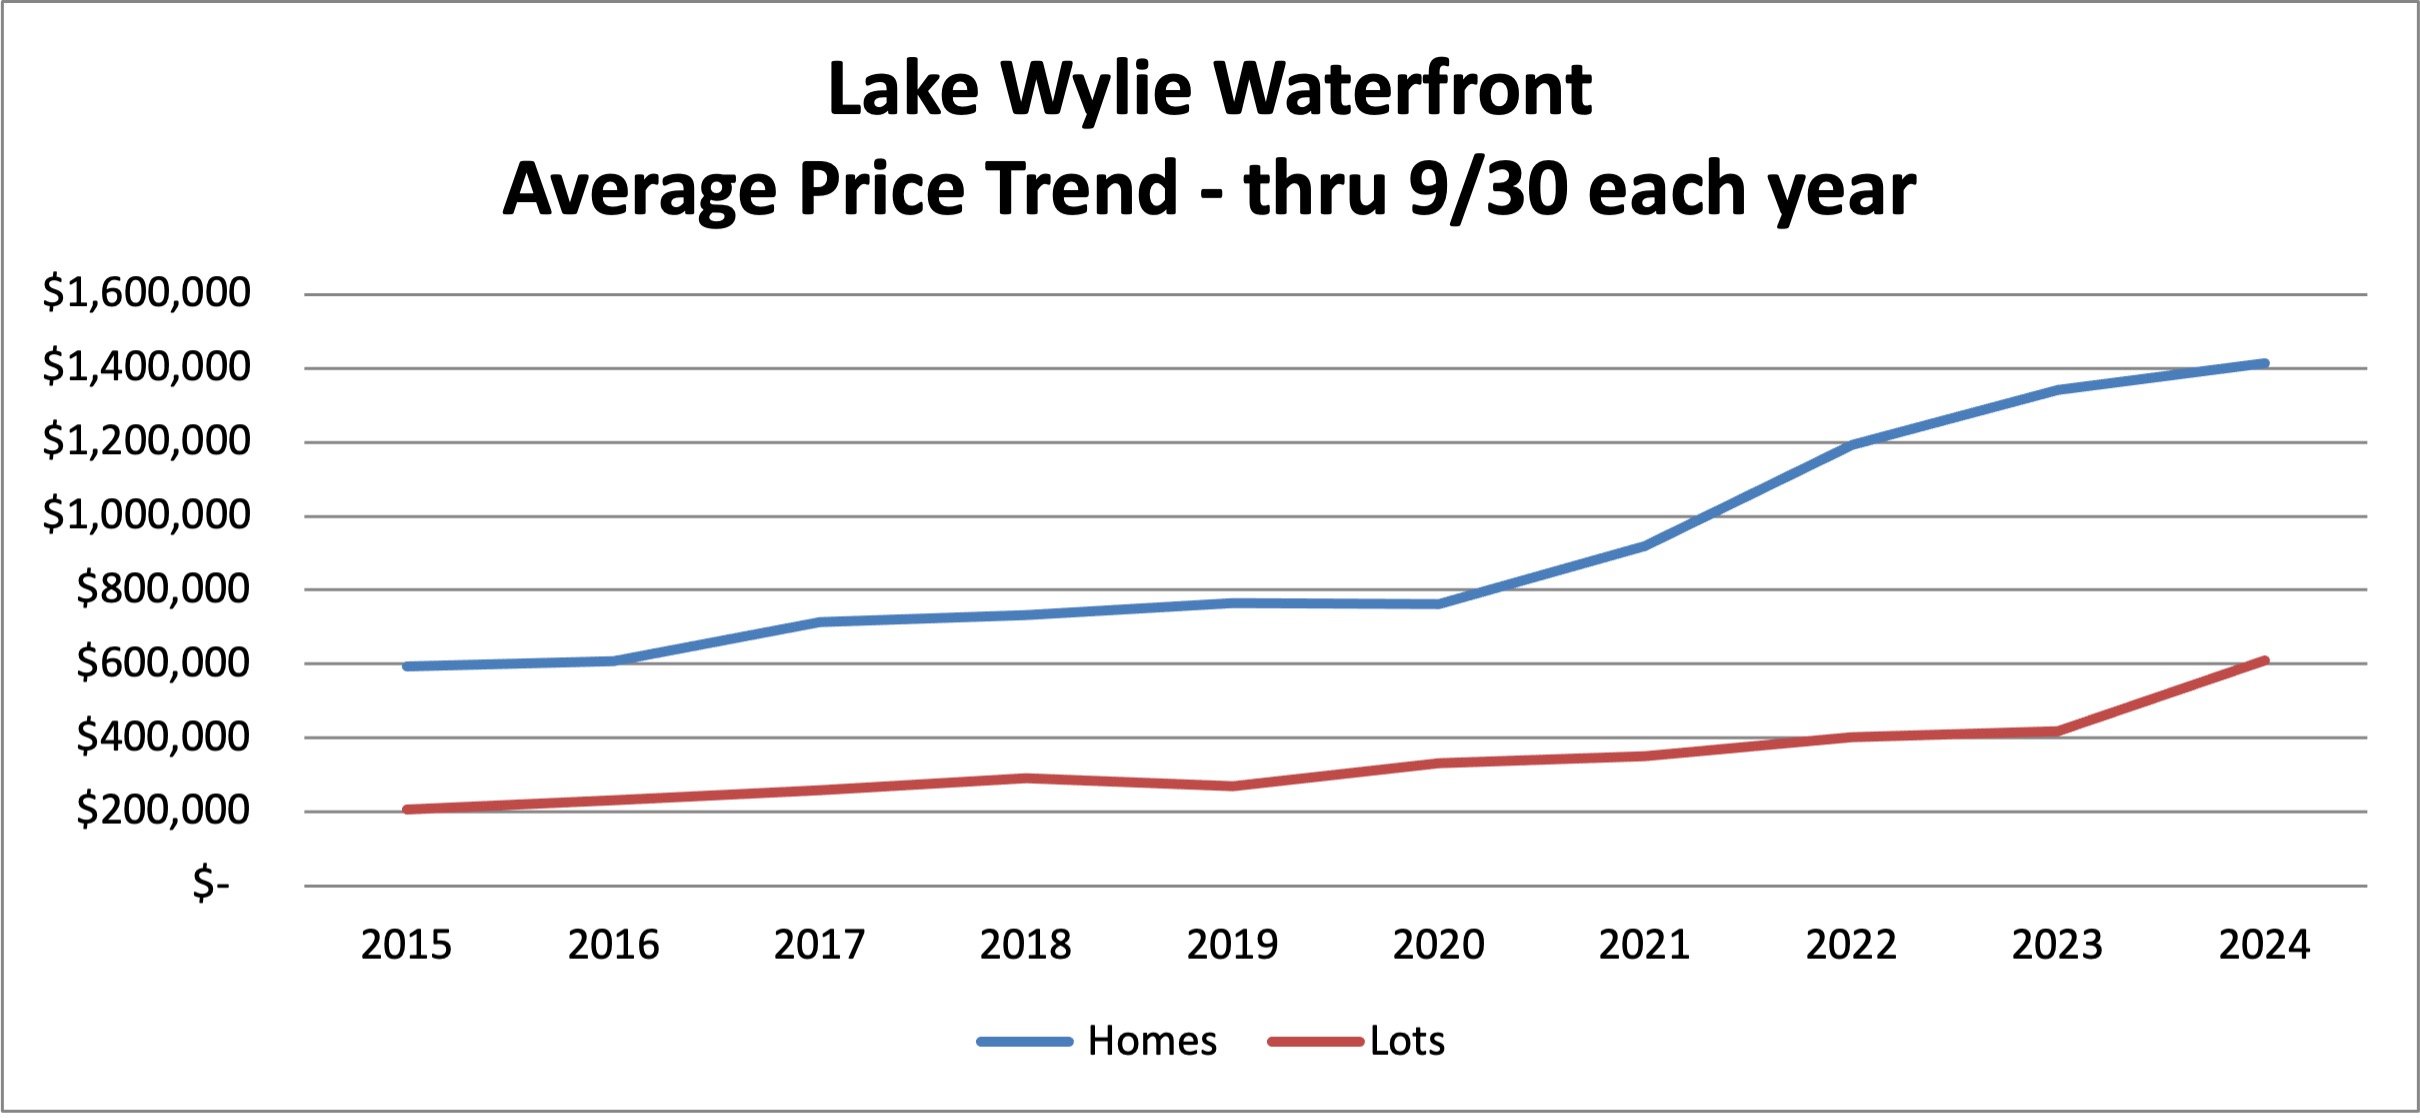
The average waterfront home price on Lake Wylie has topped $1.4 million, up 7% from a year ago. The average lot price has jumped almost 50% from last year, up to $609,000.
What does your money buy on the lake?
Of the 62 listings currently available (including those under contract), only eight are priced under $1 million.
Homes priced under $1 million average 1,750 square feet in size, are an average of 50 years old, and are priced at $510 per square foot.
In the $1 million – $1.5 million range, the homes average 3,300 square feet, 23 years old, and are priced at about $425/square foot.
At $1.5 – $2 million, homes average 4,250 square feet in size, 25 years old, and are priced at $430/square foot.
Between $2 – $3 million in price, the average home listed is 6,000 square feet and 20 years old, priced at $400/square foot.
There are five homes priced over $3 million, with one home at $6.5 million, a 15,600 square foot house located on 11.5 acres in The Sanctuary.
Note: Prices for waterfront property are affected by a number of factors beyond the quality, size and age of the home — including location (both on land and the area of the lake), cove vs. open view, topography of the lot, water depth and clarity, quality/size/age of dock, shoreline features, and other factors unique to waterfront property. Traditional square-foot comparisons can be misleading. A tiny “cabin” on a premium lot with a long-range view may sell for the same price as a large primary home tucked in a cove.
Seasonality of sales
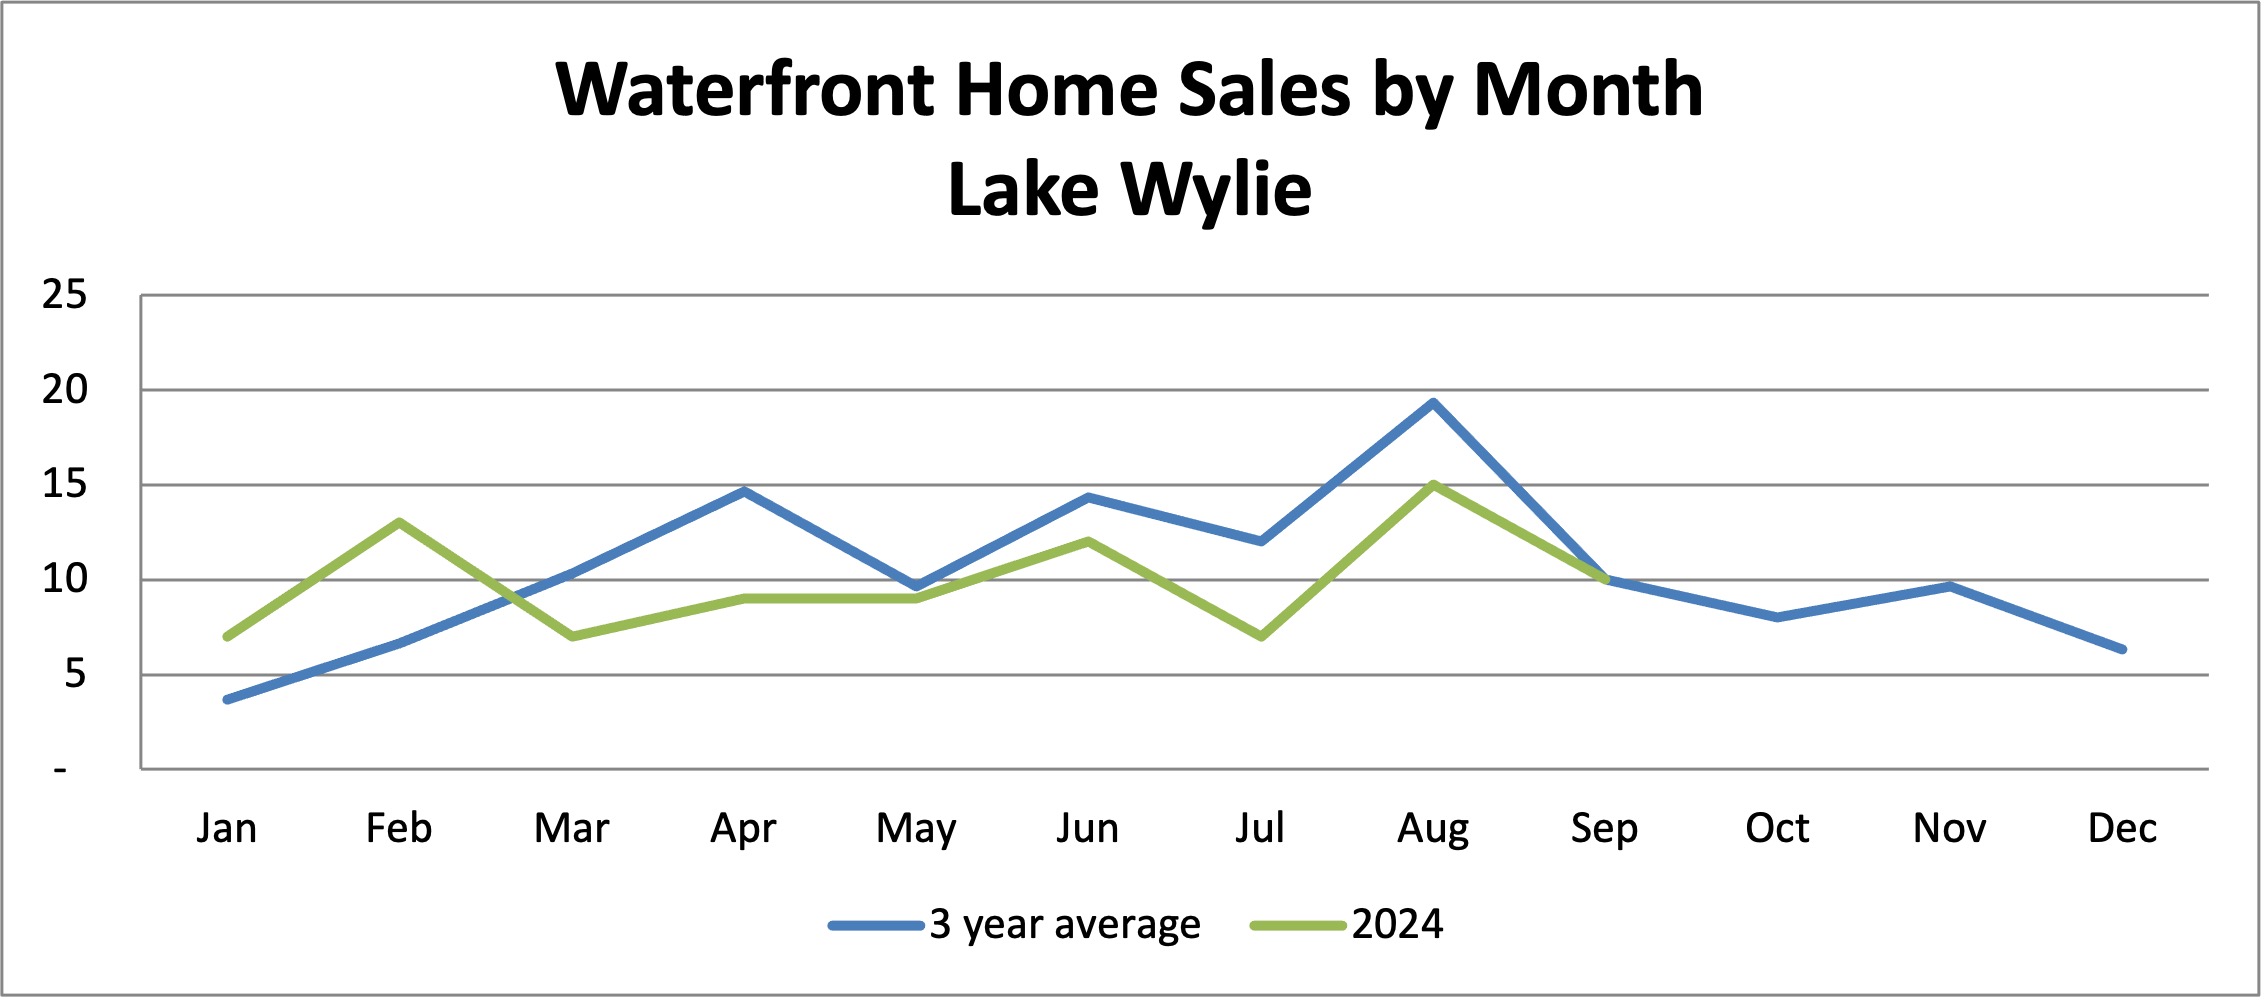
In the chart above, the blue line represents the number of waterfront home sales by month averaged over the past three years. The green line represents this year’s sales. While we started out with higher sales in January – February, spring sales were sluggish and summer sales fell below the 3-year average.
Typically our busiest time for showings and sales is March through August— but there are still plenty of buyers active in the fall months.
We may see some increased activity during the final quarter of this year, with easing interest rates.
Other key trends
- Time on the market has increased significantly. Last year, the average waterfront home sold was on the market just 30 days prior to going under contract. This year, the average is 51 days.
- While some homes sell at full price or above, the average sale is 95% of original asking price.
- Not surprisingly, those that sell for 15% or more below the original price also have longer time on market — an average of 117 days. Overpricing extends the time to sell and requires deeper price cuts to generate offers. The seller runs the risk of potential buyers moving on to another property.
- Lake “cabins” are in high demand, with 15 sales so far this year, at an average price of about $925,000. Lake cabins usually have 1-2 bedrooms, are under 1250 square feet or so, and are often 50+ years old. Sometimes buyers purchase these cabins as weekenders, while others remove the cabin and use the lot to build a primary home. Renovated cabins, or those located on premium lots, generally sell very quickly.
- Waterfront lots usually take longer to sell than homes. The average for lots sold year-to-date is almost five months.
General market trends
Off the lake, home sales in the greater Lake Wylie area are down about 4%, and prices are up 5%. The average non-waterfront home in the area sells for just over $500,000, at a price per square foot of $214.
Non-waterfront homes sell a little faster than waterfront property, with an average time on market of 39 days — no change from a year ago.
For more details on Lake Wylie waterfront properties sold to date this year, please visit my webpages Recent Waterfront Home Sales and Recent Waterfront Lot Sales.
Once again this year, The Lake Wylie Man team is leading in lakefront sales, claiming the #1 agent position in the market now for more than 15 years. I appreciate the opportunity to work with you. If you have any questions or wish to discuss your property, please give me a call.
All the best,
Drew