Looking towards spring – Lake Wylie real estate

It won’t be long until the daffodils start popping out of the ground, and the real estate market enters its busy season. Waterfront home buyers are eagerly awaiting new listings!

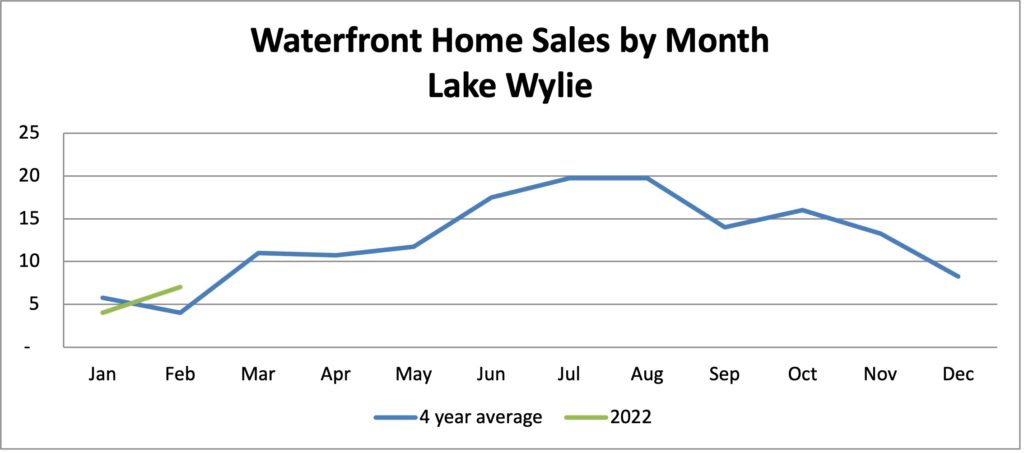
In January, four waterfront homes and one dockable lot were sold on Lake Wylie — which is within the norm. January closings usually represent properties sold in mid-November through late December, the holiday season when showings and buyer activity drop off a bit.

If properties “in the hopper” (under contract and ready to close) are any indication, we’re off to a strong start in 2022 for another robust year.

Listing inventory is beginning to inch up a bit, but still drastically lower than pre-pandemic. There are only 34 waterfront homes currently listed — and two-thirds of those are under contract. Thirty-three dockable lots are on the market, with 12 under contract.

Properly priced properties — particularly those in high-demand locations — continue to receive immediate buyer attention, multiple showing requests and fast offers, many at full asking price or even higher.

Of the properties currently listed that have been on the market for more than 2 months, the asking price relative to square footage exceeds last year’s average by 75%. However, it it important to note that evaluating waterfront property prices by square footage is tricky. Unlike a typical “neighborhood home,” waterfront property prices are driven by the view, water depth, location on the lake, type and condition of surrounding properties, topography, the style of dock and other lakeside amenities, and the home style/age/condition. A small lakefront cabin with a tremendous main-channel view and favorable location my have a much higher cost-per-square-foot than a newer, upscale home in the back of a cove, for example.

In this market, if a home lingers without an offer, the listing price should be examined, as well as feedback from the showings.


Waterfront cabins

Last year was an excellent year for Lake Wylie “cabin” sales, with 25 sold across the lake. We define “cabins” to be properties originally designed as “weekenders,” small in size (usually 1400 square feet or less). Most were built 40-60 years ago, when many of the lake lots were leased and people did not build permanent homes on the properties. Over the years, when people were able to purchase the lots, some of the cabins have been removed to make room for primary homes, and others have been retained to use as vacation homes. Many have been modernized and renovated.

As waterfront homes have risen in price and available inventory has been limited, cabin properties have risen in popularity as a way for buyers to own lakefront property, and potentially build their primary home on the space at a later date. Prices of the cabin properties has climbed in the past few years:

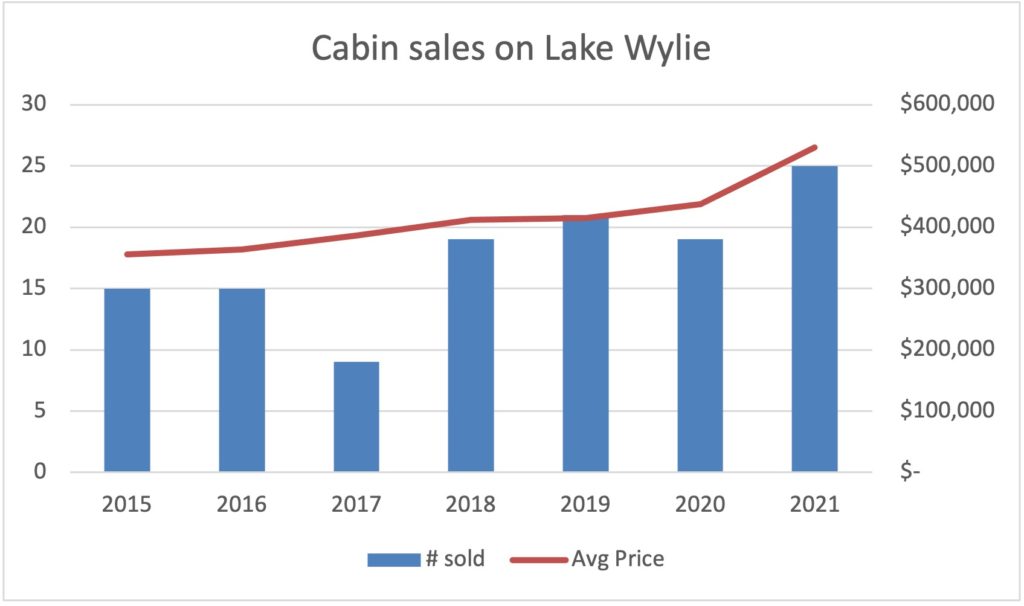
In the chart above, the blue bars represent the number of cabin sales each year. In 2021, the number hit a recent high mark with 25 cabins sold. The red line represents the average price. Prices have been steadily climbing since 2015, and took a sharp increase up to $530,000 in 2021, a 21% gain over the average price in 2020. This is consistent with the price increase for all waterfront properties on Lake Wylie last year.

We anticipate demand for cabin properties to be strong again this year. For some buyers, a renovated cabin might serve as their primary home, a more affordable option for living full-time on the lake for empty-nesters and others who don’t need a large dwelling. For others, cabins may serve as a get-away on weekends or summer. Some of these properties — depending on restrictions in the area — may be used as vacation or long-term rentals.


Lot Sales

Listing inventory has been at record lows. However, the new McLean Hunts Point development infused a dozen or so properties into listing inventory in the past couple of months. Of the 14 lots listed on the MLS — with most asking prices in the $400’s and $500’s — half are already under contract.

Most of the listing inventory for dockable waterfront lots is in Belmont, the location with the most undeveloped waterfront land. With just a couple of dockable lots priced under $200,000, the listing price for most dockable lots currently available range from the mid $200’s (cove lots) to $800k (premium point lot in McLean’s luxury neighborhood, with long-range view).


Listing your property

If you’re thinking about listing your property, there is no better time. Buyers are waiting and ready, checking for new listings daily. You can take a look at recent sales on Lake Wylie on my webpages, Recent Waterfront Home Sales and Recent Waterfront Lot Sales to get an idea of prices on the lake — but your best source (of course) is The Lake Wylie Man. With more lakefront selling experience than any other Realtor® in the area, you can count on me to answer your questions and help you navigate the sale. I look forward to talking with you soon!


Drew

Lake Wylie Waterfront Update – Year end 2021

Happy New Year everyone! I wish you all the best in 2022.

I am filled with gratitude, marking the end of a successful real estate year in 2021. The Lake Wylie Man team closed 52 waterfront transactions — more than 4 times the number of any other realtor — plus many more properties near or off the lake. I am happy so many people trusted us to conduct their real estate transactions and am happy we could help in the process.
It was a banner year on Lake Wylie in many ways: record sales dollar-wise, crazy low levels of inventory for sale, remarkable price increases, fast-paced sales. As we head into 2022, we expect more of the same.
Indications are “work from home” scenarios, either on a full-time or part-time basis, are here to stay. Many companies are allowing hybrid work schedules with some time in the office, some time at home. With the added flexibility, workers are moving from densely populated urban areas out to places like Lake Wylie, where they can enjoy some extra space and beautiful recreational amenities, yet still commute to the office when needed.
Rising interest rates may gently tap the brakes on our roaring real estate market, but pent-up demand — which far outpaces our supply of listed properties — should ensure a robust market into 2022.
Let’s take a look at performance in 2021:

Overall Waterfront Sales

     
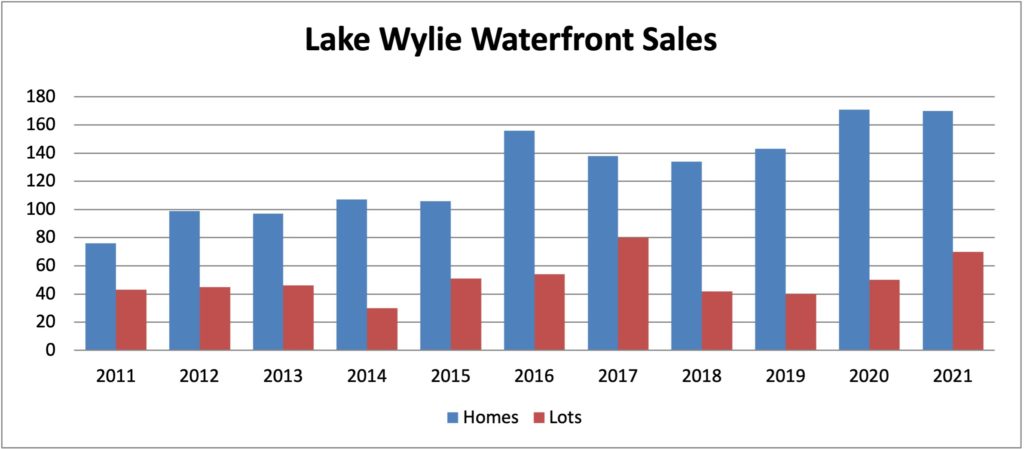
In the chart above, the blue bar represents number of waterfront homes sold on Lake Wylie each year, and the red bar represents dockable waterfront lots. The market hit a new high in 2020 for homes (171 sold), and the number for 2021 was just one shy of that record with 170 waterfront home sales.
The dollar value of 2021 sales was almost $158 million, 15% higher than in 2020 and a new record on the lake.
In addition, 70 dockable lots, totaling almost $24 million, sold in 2021.

Prices go up, up, up

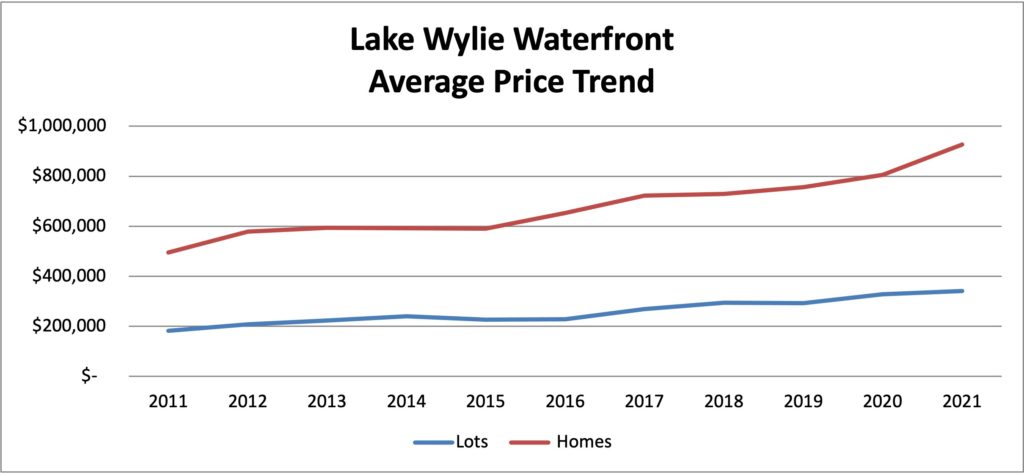
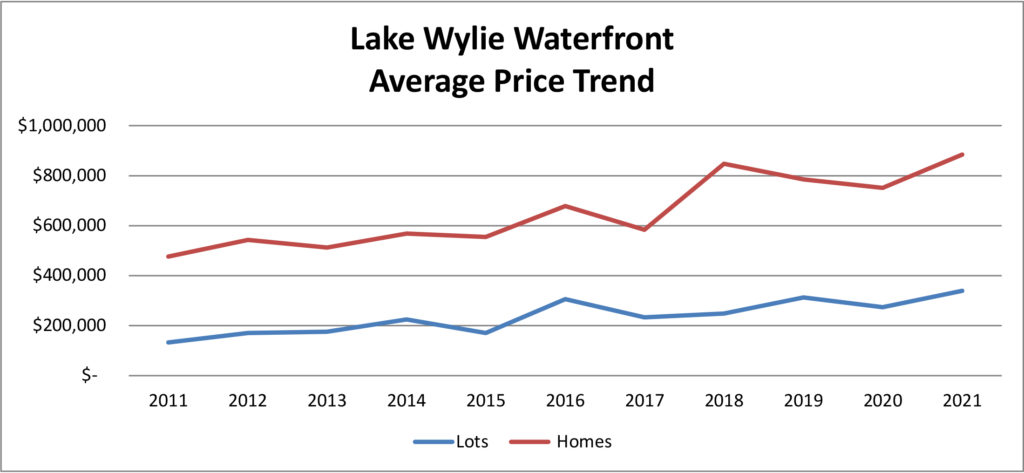
Average prices continue to go up on Lake Wylie. In the chart above, the red line represents the average sale price of waterfront homes, and the blue line represents dockable lots.
There was a sharp uptick in average prices this past year. One of the factors was the shift to higher priced homes — driven by low inventory levels (particularly in the more moderate priced segments). Prices have also increased on individual homes. Several homes that have sold twice within the past four years have increased significantly — 25% or more — in sales price with simple adjustments such as fresh interior paint.
Overall, price per square foot for waterfront homes is up over 20% in comparison to last year.
Average prices for waterfront lots are also up, now averaging about $340,000. Belmont and Charlotte — which represent about two-thirds of total lot sales — carry the highest average prices, driven by premium-priced land in the McLean developments in Belmont and large acreage lots in The Sanctuary in Charlotte. Lots in the Clover school district, representing about 20% of waterfront lot sales, average about $275,000 in price, with variations according to location, lot size, water frontage, view and topography.

Shift to more expensive homes

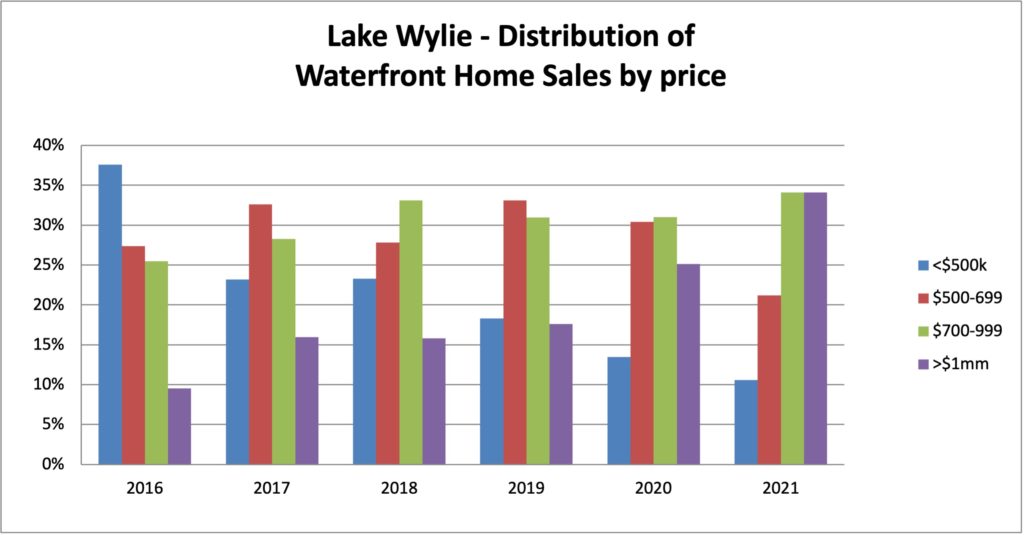
The chart above represents percent of homes sold by price each year, with the blue bar under $500k, red $500-$699k, green $700-$999k and purple over $1 million.
Just a few years ago, homes under $700,000 represented the majority of sales, with over two-thirds of the market. In 2021, only one-third of the sales fell in the lower price ranges. The $1 million+ luxury segment has grown each year, and 34% of sales (58 homes!) in 2021 exceeded the million dollar mark.
Several factors have contributed to this shift. Inflation has raised prices up on all homes. Also, buyers with deeper pockets have moved into our area — buying up the inventory of luxury homes that, until recently, outpaced demand. We’re finding as people spend more time at home, the demand is up for homes with larger floor plans, dedicated space for home offices, and amenities such as pools, outdoor living areas, fire pits, gourmet kitchens and spa-like baths.
Another contributing factor to the shift to more expensive homes on the lake is the supply side. In the past 18 months, there has been an average of just 10 waterfront homes under $700,000 in any given month (including those under contract.) Three years ago, the average was 38. Inventory has been tight on all waterfront homes, but the shortage is most pronounced in the lower/moderately priced properties.
Had lesser-priced homes been available to buyers, the total number of homes sold would have been higher, and the percentages would not have been skewed so much towards the more expensive segments. Oftentimes, waterfront buyers are able to wait for their purchase; they may live locally in non-waterfront homes, or may have flexibility in their move dates. From working with a number of waterfront buyers, we know there is pent-up demand for waterfront homes, in all price segments but particularly in the more moderate price segments.
At the beginning of January, there were only 26 waterfront homes listed, with 16 of those under contract. This is down by 37% in comparison to the same period in 2020, and down by 65% in comparison to 2019.

What can my money buy?

As prices go up and inventory shrinks, buyers find their budgets don’t go as far on the lake as they used to. On the average, homes by price range can be described as follows:
  • Under $500,000 – Average age of home is 47 years, 1,475 square feet. Includes “cabins” and some smaller primary homes.
  • $500k – $699k – Average age of home is 37 years, 2,225 square feet. Most are not in traditional neighborhoods, but may be adjacent to The Palisades, older areas of Tega Cay, Allison Creek and Concord Road area, Armstrong Road area in Belmont. “Big view” cabin properties often fall into this price range.
  • $700k – $999k – Average age of home is 28 years,  3,175 square feet. Newer homes in this price range may be in neighborhoods such as Harpers Point, McLean Overtake in Belmont, Somerset at Autumn Cove in Lake Wylie. Most of the recently built homes in this price range generally do not have big views. Some of the older, smaller homes in this price range do have wide open views and are in excellent locations, such as River Hills, Tega Cay and the community of Lake Wylie.
  • $1 million plus – Average age of home is 19 years, 4,680 square feet. Most homes in this price range have long range water views, outdoor living areas, gourmet kitchens. As the price goes up, the luxury factors and location desirability increase as well!

Two waterfront homes sold for more than $2 million in 2021 — one in The Sanctuary and one near The Palisades.

Luxury home sales (over $1 million) were disbursed geographically around Lake Wylie, with 15 sales in the Charlotte area, 14 in York, 11 in Lake Wylie (a total of 25 in the Clover School District!), 10  in Belmont, 6 in Tega Cay and 2 in Rock Hill.


“Cabins” — properties generally used as secondary homes, most 50 years old or more and under 1,400 square feet — topped the half million mark for average sales price in 2021, coming in at almost $530,000. Many of the cabins have been updated with modern appliances and a few comforts, and many are located on premium, “big view” lots. Sometimes buyers purchase the properties to use for build sites for primary homes, and others use as vacation homes. In some cases, the cabin property is “highest and best use” of the property; the land may not have sufficient setbacks for modern building regulations.


Seasonality of sales

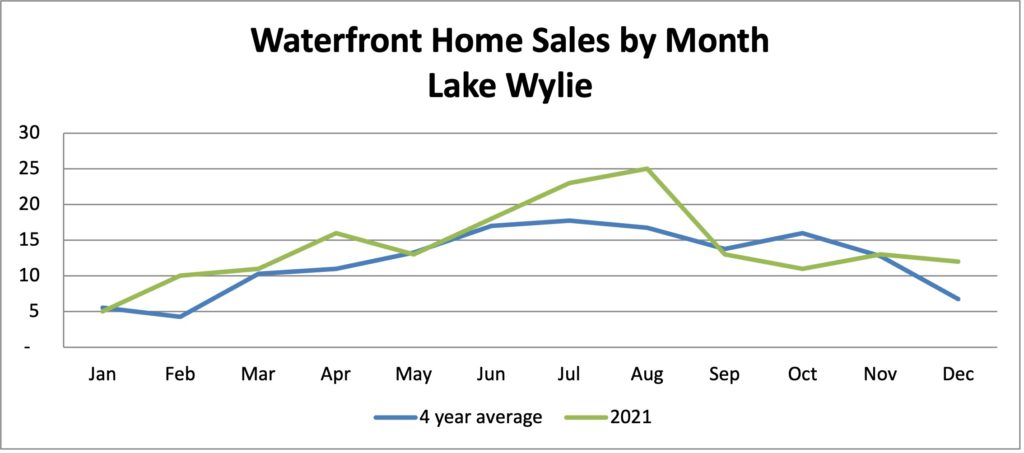
Sales in 2021 followed typical seasonality for waterfront homes:

In the chart above, the green line represents the number of waterfront homes closed by month in 2021, and the blue line represents the 4-year average. Sales are usually lowest in January/February, then begin to build through spring and summer, peaking in July/August.
Closings (as reflected on this chart) generally lag the time the properties went under contract by 6-8 weeks. Closings have taken a little longer during the pandemic.
For more details about properties closed in 2021, please visit my web pages Recent Waterfront Home Sales and Recent Waterfront Lot Sales  If you’d like an evaluation of your property or have any questions, I invite you to call or email. In this fast-paced market, a seasoned Realtor can help you obtain the best value for your property and ensure a smooth transaction. The Lake Wylie Man team is unmatched in experience and expertise on Lake Wylie. We’ve been the top-selling team for well over a decade.

Lake Wylie real estate update – Nov. 2021

The listing inventory shortage has caught up with us. All year, it has been a wonder that waterfront sales on Lake Wylie have been so strong, while the number of listings has been at record lows. As new properties were introduced to the market, many of them sold within a few days after being listed.
Now, the number of new listings — particularly those priced under $1 million — are so few that sales have slowed significantly. In October, only eight waterfront homes closed — half of the typical number of closings this time of year.
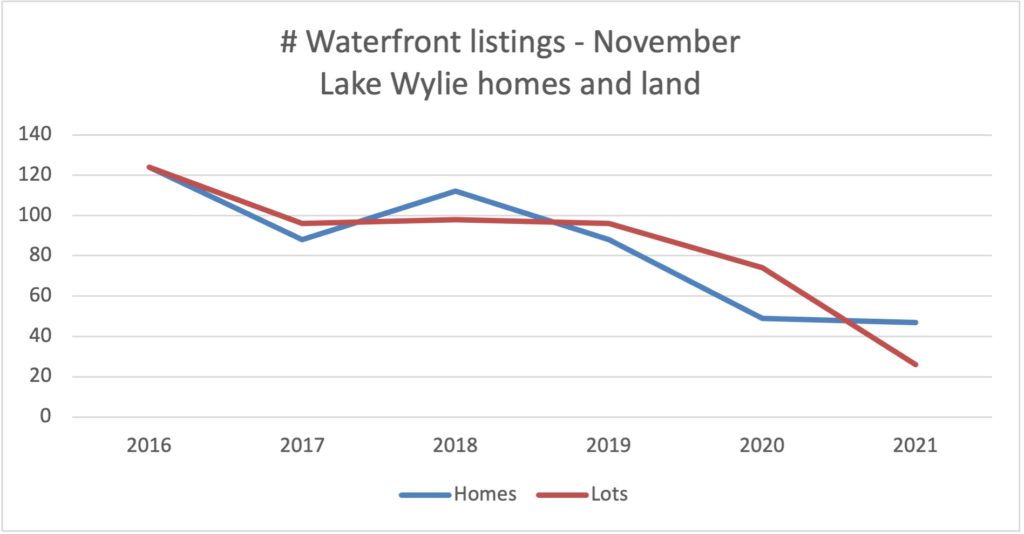
Listings for both waterfront lots and homes are at record lows at the first of November:
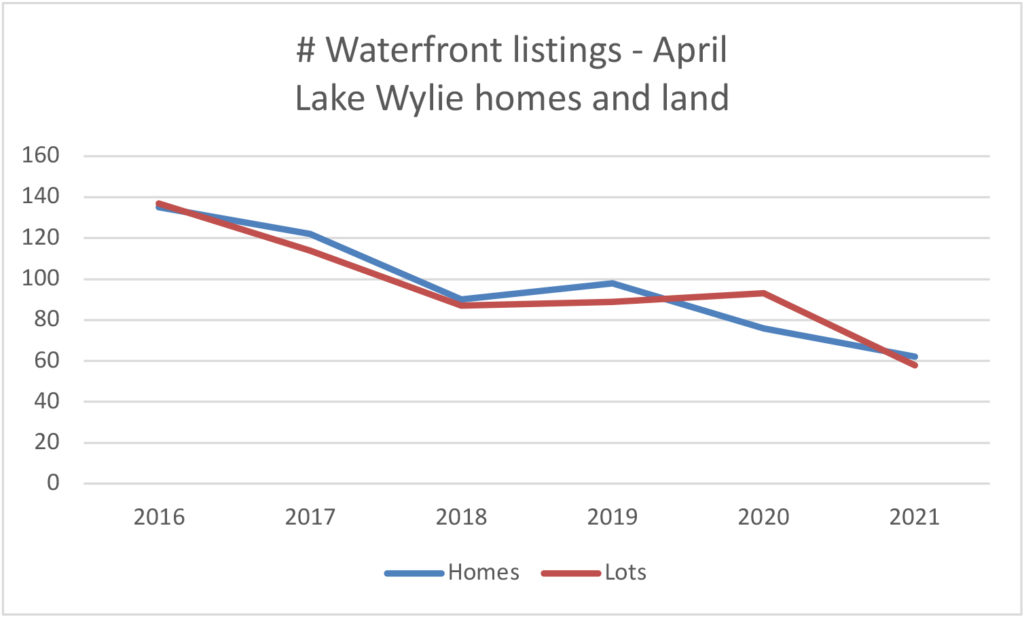
In the graph above, the blue line represents the number of waterfront homes listed on Lake Wylie at the beginning of November each year since 2016, and the red line represents the number of lots listed.
Listings began their steep decline during the first year of the COVID-19 pandemic when many new buyers were attracted to Lake Wylie and the supply of properties could not keep up with the demand. The trend continued into 2021.
Now, of the 47 active waterfront home listings, over half are under contract. There are only 21 fully available, and just 3 of those are priced under a million, with the lowest priced available home at $899,000. Buyers for homes at all price points are waiting in the wings — but particularly for homes priced under $900,000.
Because of the strain on listing inventory, we expect waterfront home sales to fall 5-10% behind last year’s numbers.
Waterfront lot availability is also at its lowest level, with only 26 on the market. The high demand for homes, without sufficient inventory to feed the hungry buyers, led many waterfront buyers to choose to build new homes on the water. Sales in 2021 for waterfront lots are at one of the highest levels ever.
Waterfront prices
Driven by high demand and low supply, waterfront home prices are now averaging just over $930,000, and waterfront lots are averaging in the mid $300’s. The price per square foot for waterfront homes is up 23% over last year and 35% over the year before. Price increases on a few homes that sold in the past three years —then resold in 2021 —confirm that homes in “move-in-ready” condition can fetch significantly higher prices in the current market.
Undeveloped lot prices are varied. There are buyers willing to pay top dollar for premium lots — those in higher end neighborhoods or lots with excellent location and views. Cove lots and those in more remote locations are still selling in the $200’s.
Mortgage rates
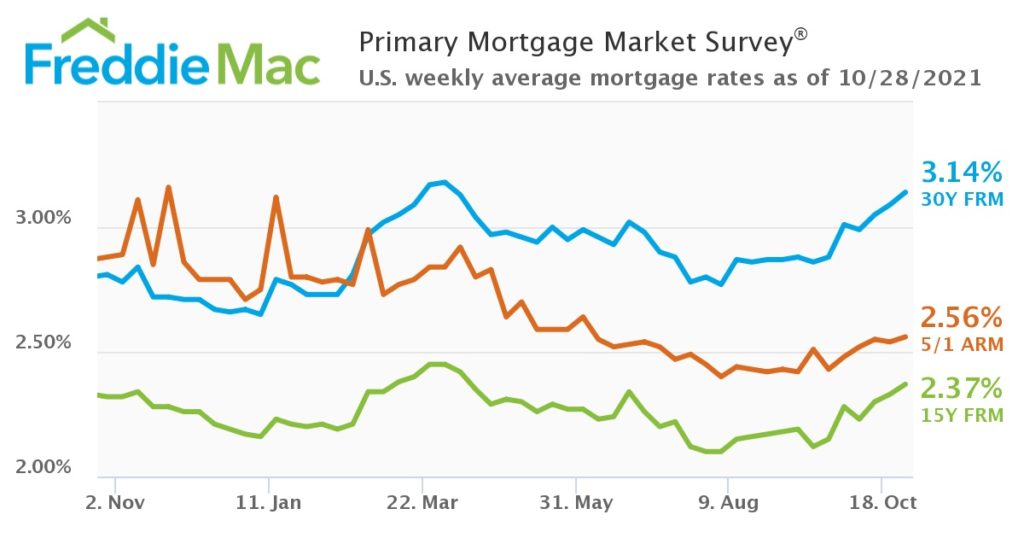
Mortgage rates are beginning to inch up again:
In the graph above, shared by Freddie Mac, the blue line represents 30-year rates, the orange line 5/ ARM rates, and the green line 15 year rates. In the past 12 months, 15Y and 30Y peaked in March, and are now approaching those rates again in early November.
Building material shortages, which became an issue early in the pandemic, are still in play.
We remain very optimistic about the health of the real estate market on Lake Wylie, considering the purchase demand that is still very strong. The short time on the market for new listings, even with higher prices on homes, indicates we are still in a “seller’s market.”
Be sure to check out recent sales on our website: Recent Waterfront Home Sales and Recent Waterfront Lot Sales.
Both buyers and sellers can benefit from the advice of seasoned real estate professionals such as The Lake Wylie Man team. Our knowledge of the market and success in closing hundreds of properties on Lake Wylie are invaluable in this bullish market, and we look forward to serving you throughout the process.

3rd Qtr Update – Lake Wylie waterfront market

As we enter the final quarter of 2021, we’re just over a year and a half into “pandemic real estate.” We’ve watched out market boom, with properties selling fast and high, in spite of record low listing inventory.
 
In September, both on and off the lake, sales began to slow, just a little. Whereas at the end of 2nd quarter, we were clipping along with waterfront home sales 22% above last year’s activity, we close third quarter at just 6% above last year’s sales.
 
Why the gentle touch on the brakes? Closings in September tie to sales contracts written in July – August, when COVID numbers began to rise again. Listing inventory dipped, resulting in fewer properties for buyers to buy. Finally, closings are taking a bit longer — with higher workloads for appraisers, inspectors, repair contractors, and closing attorneys. Plus, some sellers are negotiating longer closings in order to find their own new homes
 
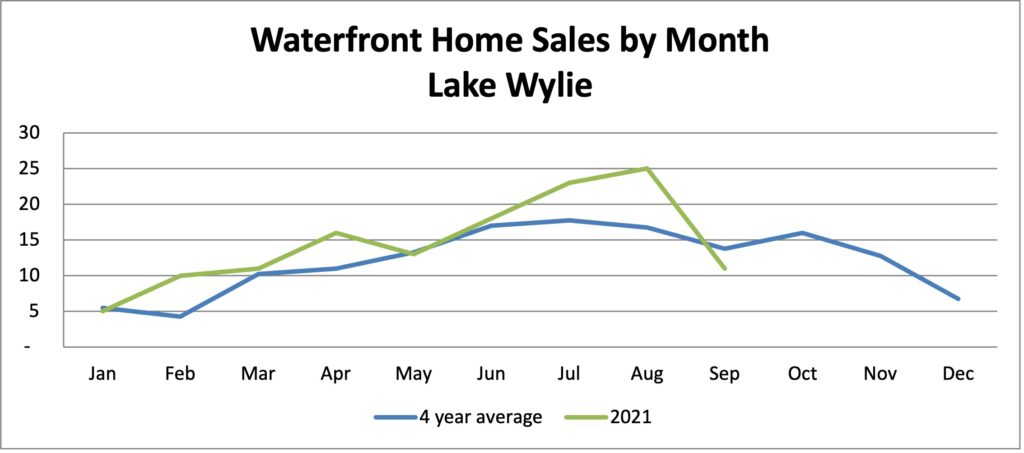
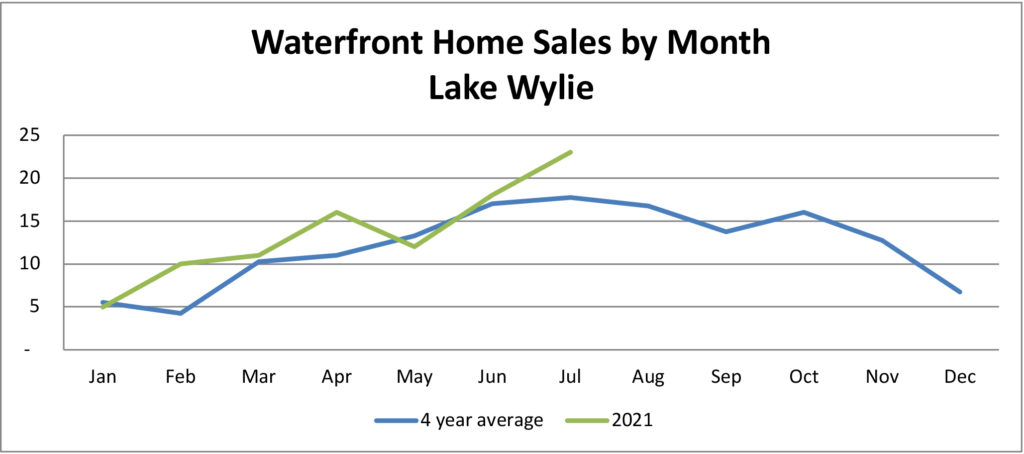
On the lake, September closings fell below the 4-year average for the month:
   
In the chart above, the green line represents the number of closings on Lake Wylie waterfront homes by month, and the blue line represents the 4-year average from 2017-2020. Up until September, this year’s activity was at or above the average each month. 
Waterfront sales trends
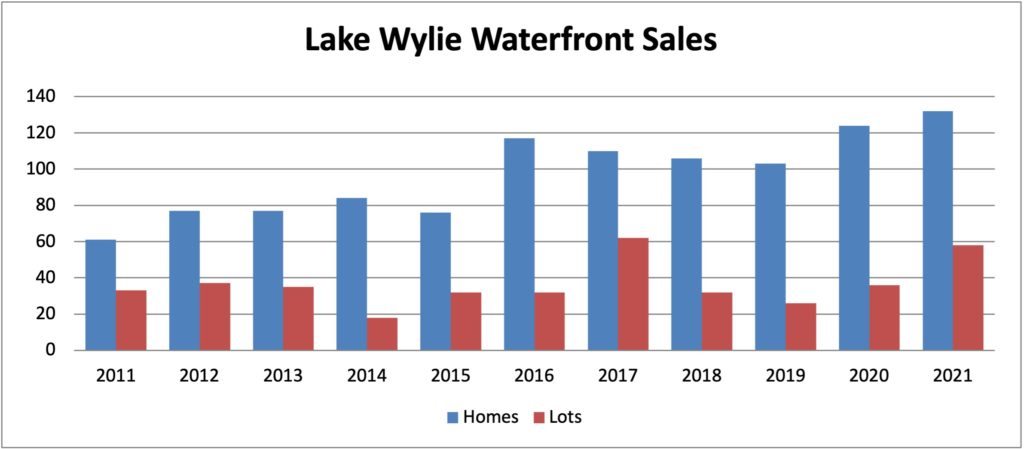
Year-to-date, the number of waterfront home sales on Lake Wylie is up 6% in comparison to last year. Waterfront lot sales are up 61%. The sales trend for the past decade:
In the chart above, the blue bars represent the number of waterfront homes sold on Lake Wylie through the end of 3rd quarter each year. The red bars represent dockable lot sales.
Beginning in 2016, waterfront home sales popped up to record levels on Lake Wylie, with new developments being built on the lake and an influx of population — buyers with deeper pockets to purchase luxury lake homes. 
Waterfront lot sales tend to vary a bit more year-to-year. The introduction of McLean developments in Belmont brought premium lots on the market, increasing sales and prices in the past couple of years. 
Waterfront price trends
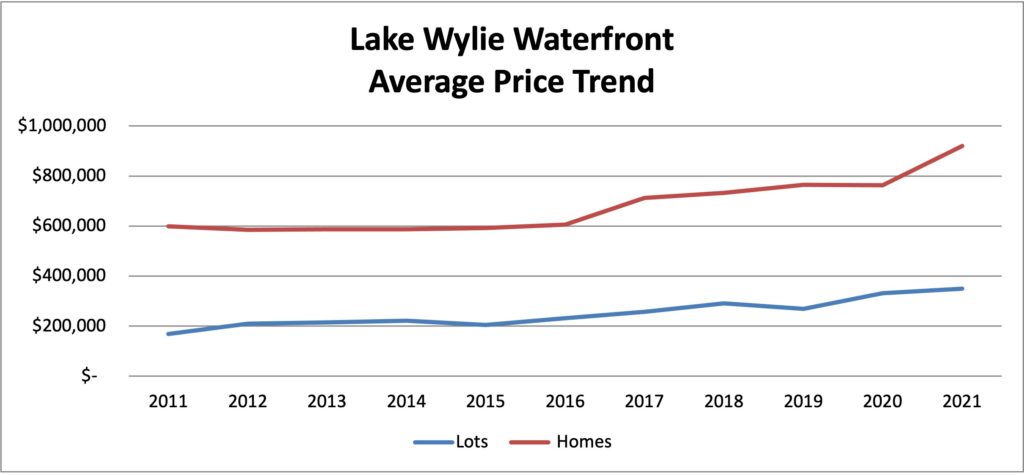
In the chart above, the red line represents the average price of waterfront homes on Lake Wylie, and the blue line represents lot prices. After a plateau in the first half of the decade, prices began to sharply increase in 2017 and again in the past year.
The average waterfront lot price is now $350,000, up 5% from last year and up 30% from pre-pandemic. Thus far in 2021, eleven lots have closed in McLean for prices in the mid $300’s and up, plus six lots in the Sanctuary (averaging in the $500’s).  
The average waterfront home has reached $920,000 — an all-time high. Year-to-date, 45 homes have close at over $1 million, about 34% of total home sales on the lake. Last year, we reached an all-time high of 25% of home sales in this luxury price range.
Not only are sales shifting to higher-priced properties, but prices have increased across the board. Price per square foot is up 35% above pre-pandemic (2019) prices for waterfront homes on Lake Wylie, and up 26% for non-waterfront homes in our area.
Listing inventory 
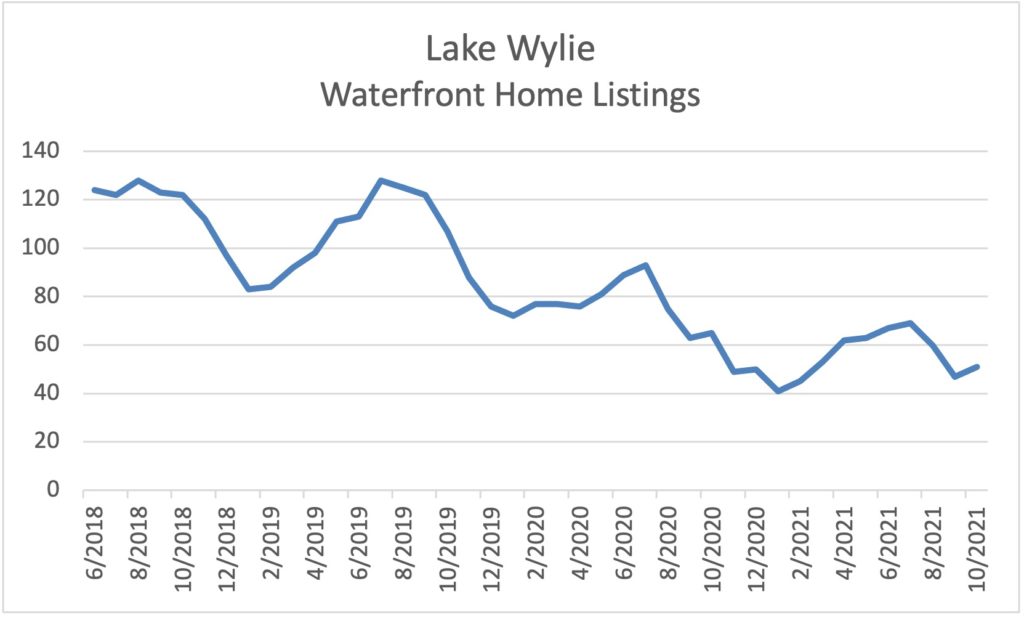
For waterfront homes, listings usually peak in June-August, then taper off as we approach the end of the year. A three-year trend shows typical peaks and valleys in listings:
The chart above shows the number of active listings (including properties under contract) for waterfront homes on Lake Wylie over the past few years. Listings generally top out in summer and reach their low point in December/January. 
 
What is remarkable about this 3-year look is how the peak number of listings has dropped from 125 or so to 65. Yet even with the tightening of supply, the increase in demand has resulted in significant sales increases during this same time period. Average time on the market for waterfront homes is just 31 days — compared to 4 months or so in recent years.
 
The listing shortage has also contributed to price increases.
 
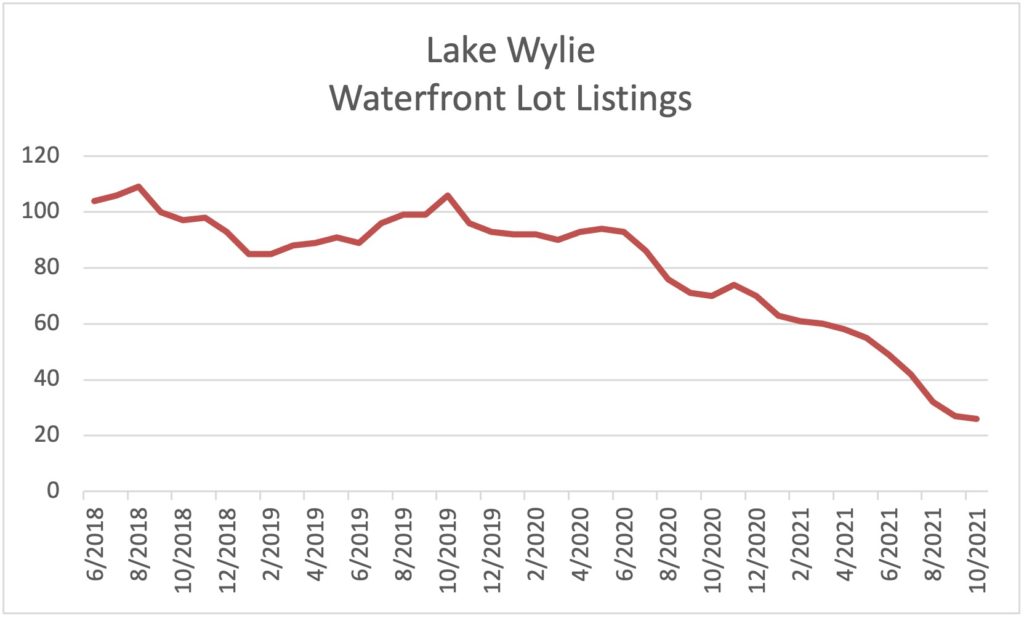
Waterfront lot listings are even more limited:
The chart above shows the number of dockable lots on the market from month to month. The peaks and valleys are not as pronounced seasonally as they are for homes — as the sale of raw land aren’t as dependent on buyers’ and sellers’ moving schedules (higher in the summertime.)
 
What is remarkable about the lot listing trend is the rapid decrease in the number of listings since last summer. At the beginning of the decade (not shown on this chart), there were about 200 lots listed. At the beginning of October 2021, there were just 26. Vacant land is rarer on the lake, as more land along the shorelines has been developed over the past few years. 
 
If you’d like more detail on the sales behind these charts, visit my web pages Recent Waterfront Home Sales and Recent Waterfront Lot Sales
 
Over the years, The Lake Wylie Man team has closed hundreds of waterfront properties, and we have unparalleled expertise on the lake. In this volatile market, it is important to rely on the #1 Realtor to advise you on the unique considerations for lake property and ensure a successful closing.
 
Thus far in 2021, we’ve completed 43 waterfront transactions — more than 3.5 times as many as the next highest-selling Realtor on Lake Wylie.

A hot market in the dog days of summer

Back-to-school may be just around the corner, but the summer real estate sales surge is still in full swing. We’re on track for the highest number of waterfront homes AND the highest number of waterfront lots sold in well over a decade of tracking. Lake sales are hotter than the dog days of summer!

 
According to a recent article in MoneyWise, South Carolina had the sixth-highest rate of population growth in the country, and North Carolina was on the new resident growth list as well. People are on the move, attracted by the beautiful natural resources in the Carolinas, as well as the lower cost of living in our suburban areas (compared to places in the Northeast and California.) The availability of larger lots, pleasant climate and laid-back lifestyle were also cited in the article as draws to our area.
 
Tight inventory and high demand have affected prices both on and off the lake, however. In comparison to 2020, average price per square foot has increased:
 
  • Lake Wylie waterfront homes +25%
  • Non Waterfront Homes in Mecklenburg County +23%
  • Non Waterfront Homes in York County +22%
  • Non Waterfront Homes in Gaston County +24%
 
The luxury home segment ($1 million+) has outperformed previous years. Year-to-date, 31 homes have closed in this price segment, representing 32% of total sales. Last year, 25% of waterfront home sales on Lake Wylie were priced over $1 million.
 
Waterfront lot prices are also climbing. Year-to-date average price for waterfront lots is about $350,000, a $25,000 increase over last year’s.

2021 Sales to date 

Lake Wylie waterfront sales trends kicked in place during the pandemic have continued through the summer of 2021. Sales by month are outpacing the 4-year average:
In the chart above, the blue line represents the average number of waterfront homes sold on Lake Wylie by month during the past four full years. The green line represents monthly activity for 2021. Most months have outpaced the average, and year-to-date sales are up 22% over the average.
Waterfront lot sales vary more in yearly totals as well as monthly seasonality. Year-to-date sales are almost double last year’s sales through the end of July.

Waterfront Listings

Meanwhile, the number of listings continue to decline:
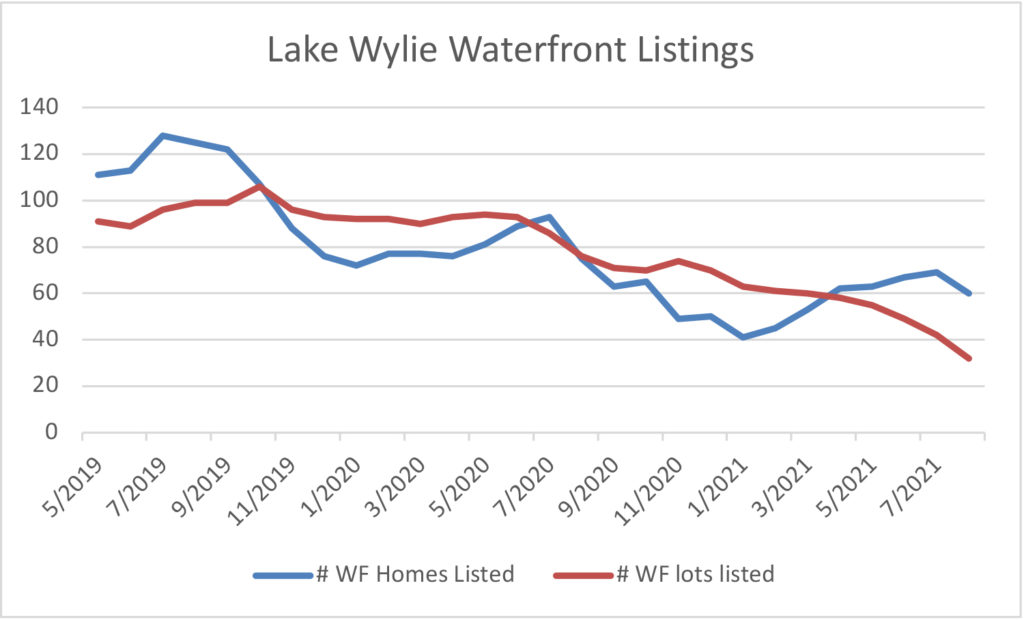
In the chart above, the blue line represents the number of Lake Wylie waterfront homes on the market from month to month (including those under contract but not yet closed.) The red line represents waterfront lots.
While waterfront home listings have trended upward since the first of 2021, the numbers have declined year-to-year. Listings at the first of August are down 20% from last year, and 52% from 2019 inventory levels in August. In addition, the portion of listings classified as “under contract” is greater. Currently, 60% of waterfront home listings are under contract, leaving just 24 homes fully “available” on the Lake Wylie market.
Typically, the number of waterfront home listings peak in July and begin to trail off as summer ends.
Waterfront lot listings have continued the steep decline. As of this week, there are only 32 dockable lots listed on Lake Wylie.
Newly listed properties continue to sell quickly. Well over half of waterfront homes sold this year were on the market less than a week, and 70% were on the market less than a month. Many sell for full asking price or above.
Recent waterfront property sales can be viewed on my website, Recent Waterfront Home Sales and Recent Waterfront Lot Sales.
In this aggressive market, expert advice is more important than ever. Please call if you’re considering selling your home or lot. As the #1 Lake Wylie waterfront team for well over a decade, The Lake Wylie Man can assist you in determining the best price, sales strategies and marketing for your property, resulting in the best outcome and smoothest closing possible.

Mid-year 2021 Waterfront Sales Update

The wild ride continues in real estate — on Lake Wylie and around the country. Sales are breaking records — which is quite a feat considering the number of listings is at an all-time low. We are starting to see just a little slowing in sales in waterfront homes, but that is simply because there are so few homes available to sell. Compared to a 4-year average by month, sales outpaced previous years in the first quarter of the year and have begun to lag below average the past couple of months:

In the chart above, the blue line represents the average number of Lake Wylie waterfront homes sold by month for the past 4 years, and the green line represents the number of homes sold this year. Seasonally, sales usually peak June through August, and the trend this year is headed in the same direction.
 
After a very strong spring, summer sales for 2021 are lagging just a little behind the 4-year average.
 
 
Lake Wylie Waterfront Sales
 
Here’s a quick snapshot compared to years past:
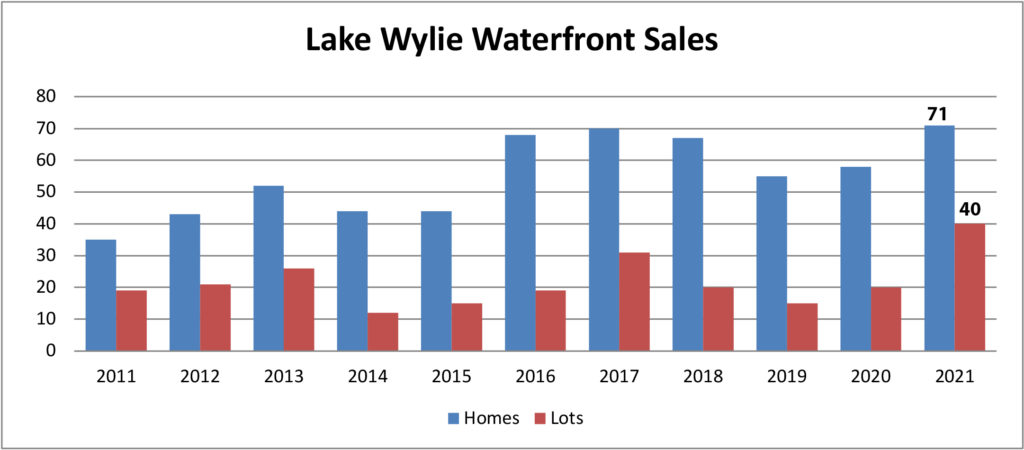
Year-to-date waterfront home sales (blue bars) on Lake Wylie reached 71 at the end of June, just topping the sales record reached in 2017. Waterfront lots (red bars) reached 40 at the mid-year mark, strongly outpacing sales reached any year this decade.
 
Prices are also at an all-time high:
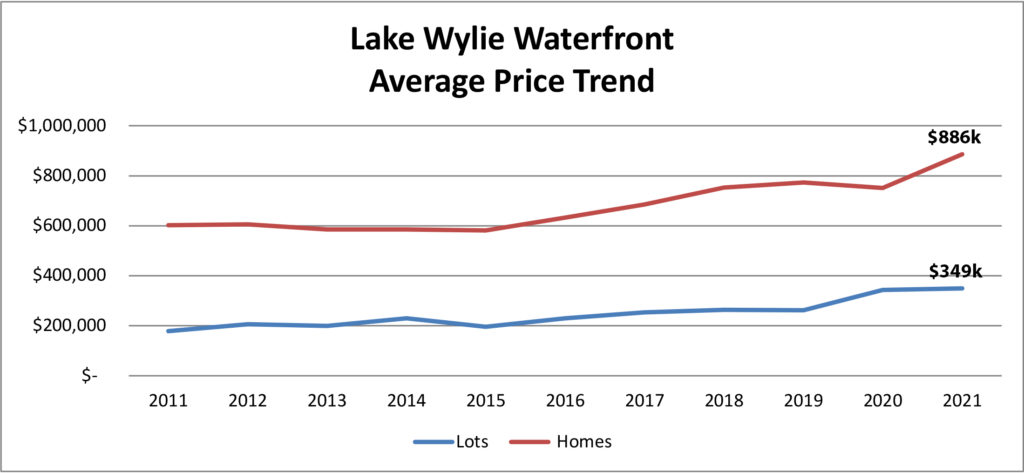
The average waterfront home price (red line) on Lake Wylie lingered around $600k for several years, then started climbing in 2016-2017. In first half 2021, prices spiked as lake home demand rose and number of listings fell. 
 
Thus far in 2021, 22 homes have sold on Lake Wylie for over a million dollars — a 57% increase over last year’s January-June sales in that price category. The shift to more expensive homes has impacted the average sale price. In addition, individual home sale prices are up 10-20% over pre-pandemic prices. High demand and low supply, again, have driven prices up. List prices out of the gate are higher — and bidding wars have bumped up the already increased prices. Finally, an influx of newer homes — carrying higher prices from more costly materials — has caused the average price to climb.
 
Waterfront lot prices (blue line) are up for individual lots. Also, we have seen a number of premium lot sales in 2021: several multi-acre lots in The Sanctuary (averaging almost $600,000), plus a 3-acre parcel in McLean for $1,300,000 and a 2-acre parcel in Woodland Bay for $821,000.
 
Other sales highlights:
 
  • The average time on the market for Lake Wylie waterfront homes is just 30 days. (For reference, the average time on market for 2020 was 115 days.)
  • Over half of waterfront home sales occurred in the first week of listing. 
  • Over half of waterfront homes sold at or above the listing price.
  • The average sales price for a cabin (property designed for “weekend use,” usually built 50+ years ago, usually under 1200 square feet or so) reached $506,000 in first half 2021, a whopping $70,000 increase over last year’s average.
  • About 25% of waterfront lots sold were on the market less than a month. Also, several lots that were on the market for several years have sold.
Inventory
 
The number of properties available for sale on Lake Wylie is at record lows. For perspective, annual sales are compared to the current number of listings:
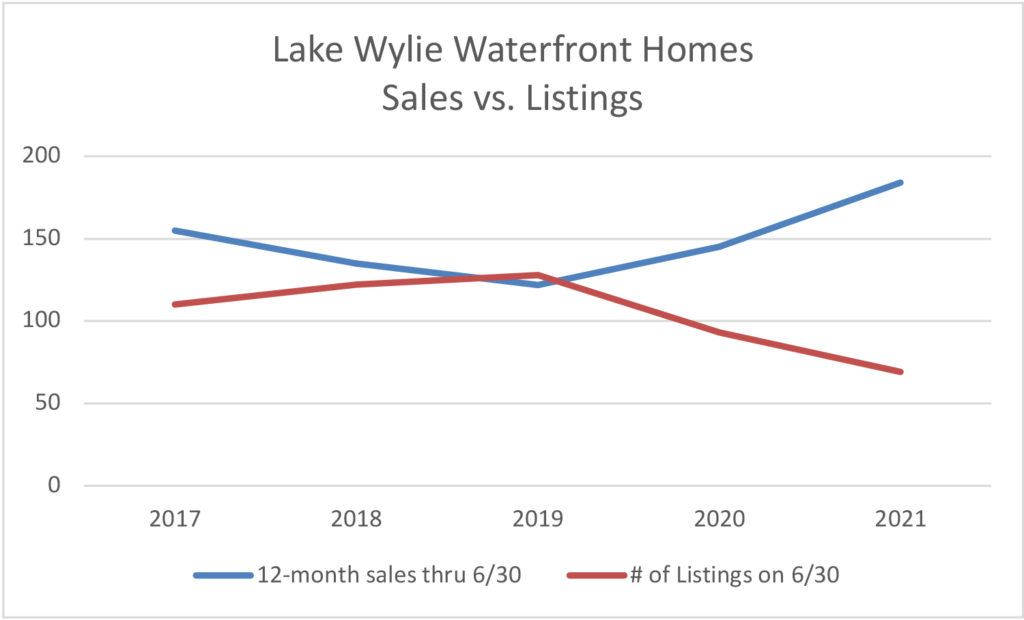
The number of waterfront homes on the market (red line) was fairly steady from 2017 – 2019. During the pandemic, sales spiked (blue line), while sellers delayed listing their homes or decided to stay put. Up until 2019, the number of listings was sufficient to cover annual demand, providing buyers a fair number of listings to choose from. 
 
Currently, there are just 69 waterfront homes on the market, and 38 of those are under contract. Pre-pandemic, there were usually around 30-35 homes under contract at any given time during the summer. Last year during the pandemic, when people began moving from urban areas to the suburbs, lakes and resorts, there were 40-55 homes under contract during summer months. We’re now below that point — mainly because available inventory is so low.
 
A similar situation exists for waterfront lots:
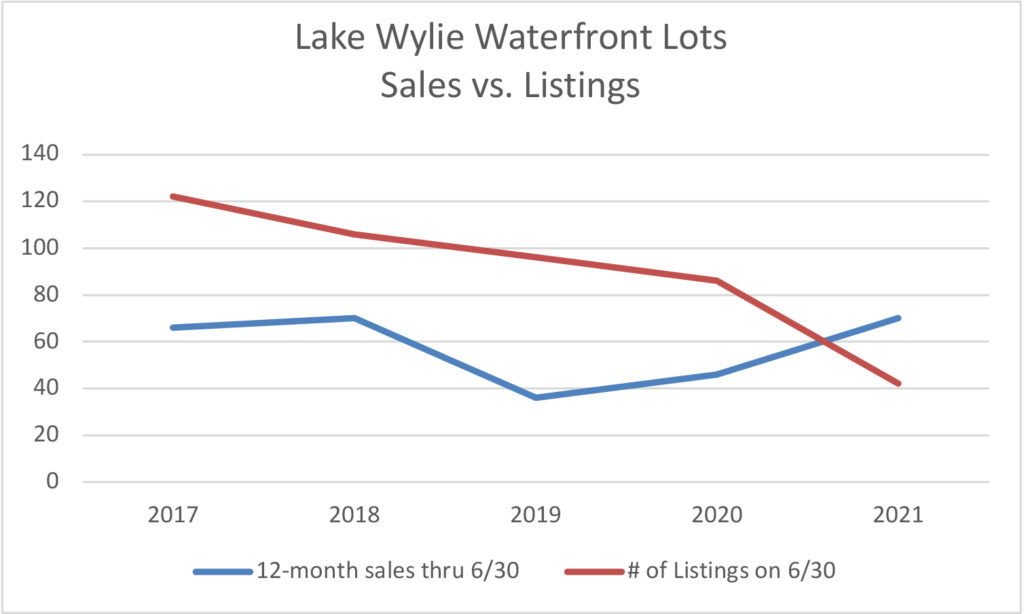
The number of dockable waterfront lots listed (red line) has declined dramatically since 2017, falling from around 120 to just 42 current listings. Even though building costs are high due to the demand during the pandemic, plus tariffs, buyers are purchasing lots to build waterfront homes.
 
It is an excellent time to list property if you are considering selling!
 
Details for recent sales are available on my website: Recent Waterfront Home Sales and Recent Waterfront Lot Sales  If you’d like to discuss the potential for your property, please give me a call. As the #1 Lake Wylie Realtor each year for over a decade, I can provide unparalleled expertise and marketing for your home or lot.

Summertime real estate on the lake – – hot stuff!

Happy summer, everyone! I know the calendar says we have a couple more weeks or so before the official start of summer, but if you’re like me, the first sizzle of a hotdog on Memorial Day weekend kicks off the season in style.
In the real estate world, summertime is more than Coppertone and watermelon and swimming in the lake. It is the busiest time for home sales — particularly for families with kids in school.
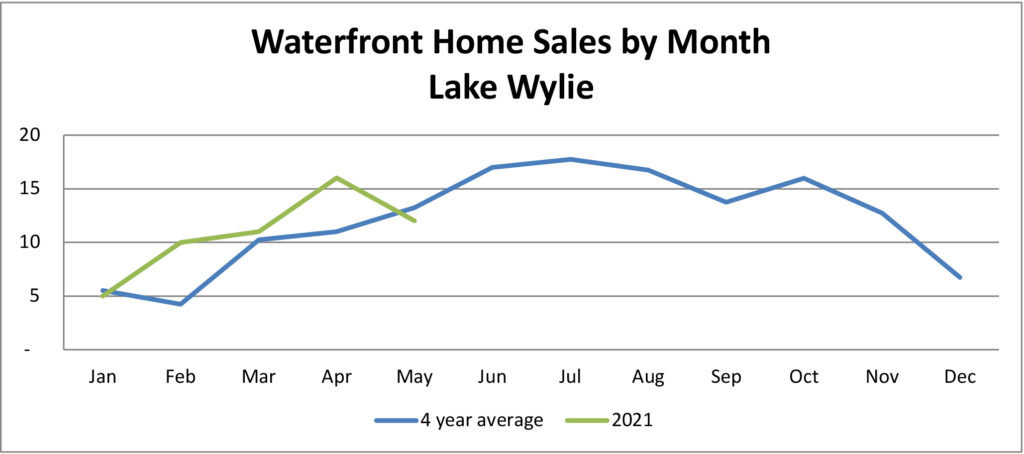
Year-to-date waterfront home sales are up 45% over last year’s, and 35% over the 2019 year-to-date sales. May sales were a bit below average, with 12 waterfront homes sold on the lake:
In the chart above, the green line represents the number of waterfront homes sold on Lake Wylie by the month in 2021, and the blue line represents the 4-year average. Sales typically begin building in early spring, and peak mid-summer, staying strong through October.
The drop from April to May in 2021 was atypical — but these are atypical times. A shortage of listings and buyer frenzy have been driving the market in recent months. The number of homes under contract has been strong, between 30-40 during the past 4 months, so for only 12 homes to close in May was a surprise.
However, about a third of the homes listed as “under contract” is new construction, which typically takes several months to close, depending on the stage of the build when it went under contract. Also, some sellers are negotiating a longer close period, to give themselves time to find a place to live.
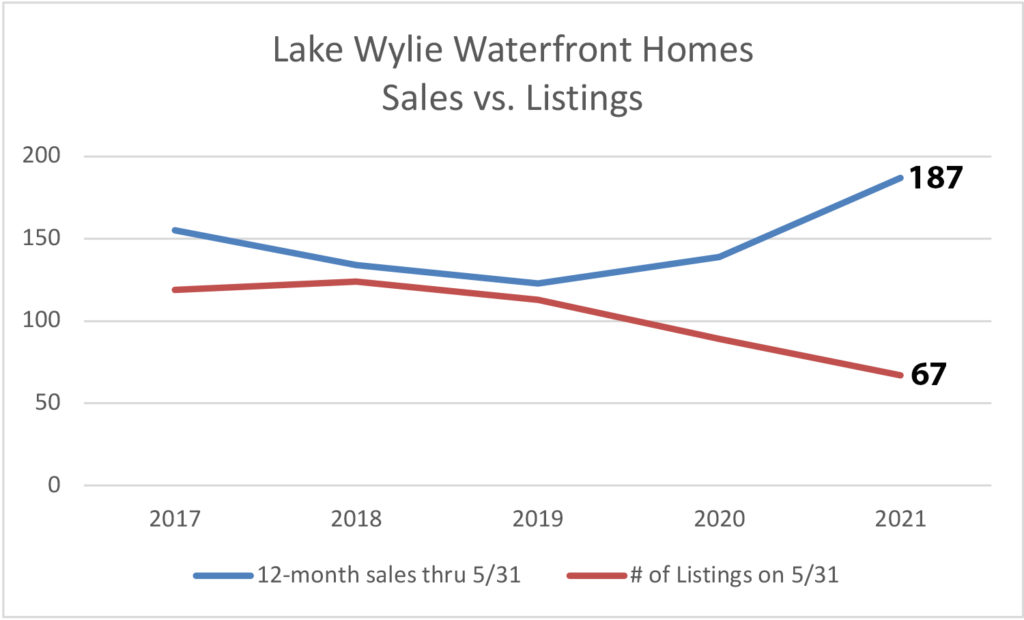
Of the 12 homes that closed in May, all but two were on the market for less than a week before going under contract. Seven sold at or above the asking price — and two sold for more than 20% above the asking price! The market is still hot, hot, hot. However, the shortage in listings is an issue:
In the chart above, the blue line represents the number of waterfront homes sold in the 12-month period ending 5/31 each year, and the red line represents the number of listings on the last day of May each year. Historically, the number of listings was close to the number of homes sold on an annual basis. That began to change in late 2019. Now the gap between supply and demand is quite pronounced — driving prices up.
Waterfront Lots
Dockable waterfront lots on Lake Wylie are having a record sales year. Despite the rising costs of construction, buyers are turning to lots to build their own lake homes when none can be found ready to buy.  The majority of sales are in Belmont and Charlotte — driven by availability.
Buyers are willing to pay top dollar for premium lots — point lots with panoramic views. The average sale price for a waterfront lot on Lake Wylie is about $350,000, the highest point since 2008.
Listing inventory is at the lowest point in years:
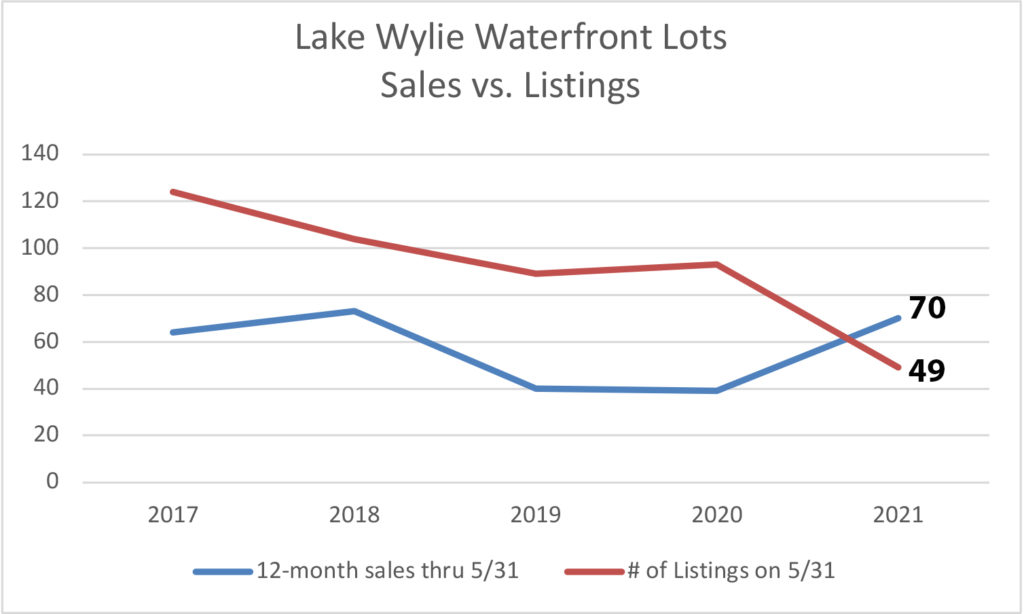
In the chart above, the blue line represents rolling 12-month sales thru the end of May each year, and the red line represents the number of listings at the end of each May. Historically, the number of listings significantly outpaced the annual sales, until 2021.  The number of listings has plummeted, and sales are the highest since 2018 (which was a record year!).
You can check out details of recent sales on my web pages: Recent Waterfront Home Sales and Recent Waterfront Lot Sales.
As we head into summer, it is an excellent time to list your property if you have an interest in selling. With hundreds of lake transactions successfully closed, The Lake Wylie team can advise you on how to price your property in this volatile market, what improvements or staging techniques will ensure top dollar, and best strategies for marketing. Please give me a call if you’d like to discuss your home or lot.

Spring Frenzy – Lake Wylie Real Estate Market

The frenzy continues in real estate sales on Lake Wylie this spring. Both waterfront homes and dockable lots are selling at record paces — the highest number of sales through April in over a decade. At the same time, the number of springtime listings is at the lowest point in years.

People are on the move, all over the country:

Americans are leaving the big cities, but they’re not going far. According to Bloomberg CityLab, they’re heading out to the suburbs, places with a little more space and access to outdoor amenities (like Lake Wylie!). About 84% of movers stayed within their same metro area.
In the Charlotte area, the mover inflow/outflow ratio was pretty flat — which means we didn’t have a large increase or decrease in population change during the pandemic, but people did shuffle around.

Real estate is big news. Prices are climbing, multiple offers and bidding wars are common, and supply (number of listings) is very, very low all over the country.

For several years after the recession (2007-2010ish), new construction slowed considerably — and we’re now feeling the supply pinch.
Though building has started up again in the Lake Wylie area, costs are high, particularly as the pandemic affected the supply of materials.
The ability (and, during the pandemic, the necessity!) to work remotely, combined with low mortgage rates, has encouraged people to start buying houses.

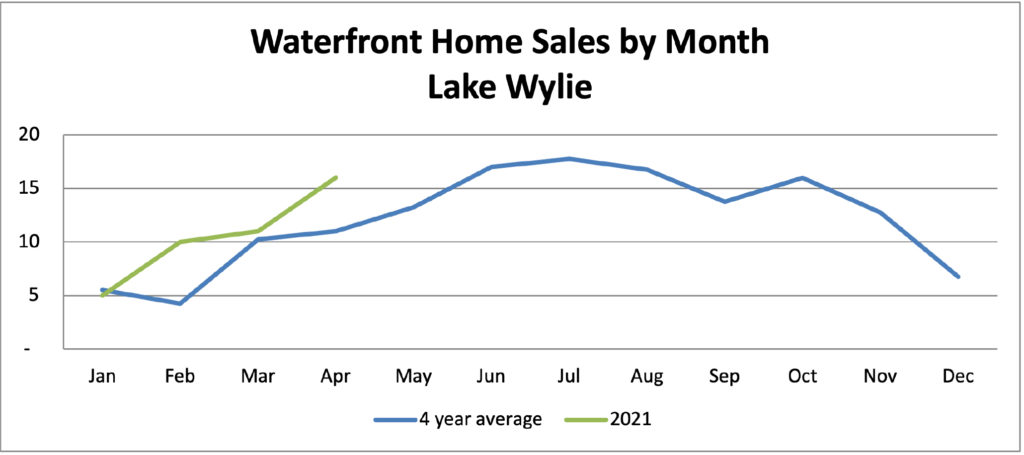
So, here we are. Waterfront home sales are outpacing the 4-year average:

In the chart above, the blue line represents the average number of waterfront homes sold on Lake Wylie, by month, over the past 4 years. The green line represents 2021 sales. Seasonally, sales are lowest in winter months (December thru February), then begin to pick up in spring.
In April of 2021, we’re approaching our summer “peak” levels. There were 16 waterfront home closings in April, and there are currently 32 under contract. Year-to-date sales (42 homes) are outpacing the average by 35%. The average sales price is up to $832,000 for waterfront homes, an increase of about 3% over last year. However – – the mix of homes sold this year to date are, on average, about 15% smaller than last year’s average, so the price increase on an individual home basis is closer to 15-20%, depending on location, price point and features.
The average time on the market for waterfront homes? An astounding 36 days. For perspective, the average time on market for the entire year of 2020 was 115 days – – more than three times as long. Through April, about 70% of waterfront home sales have time on the market of less than a month.  Half sold for the asking price or more.
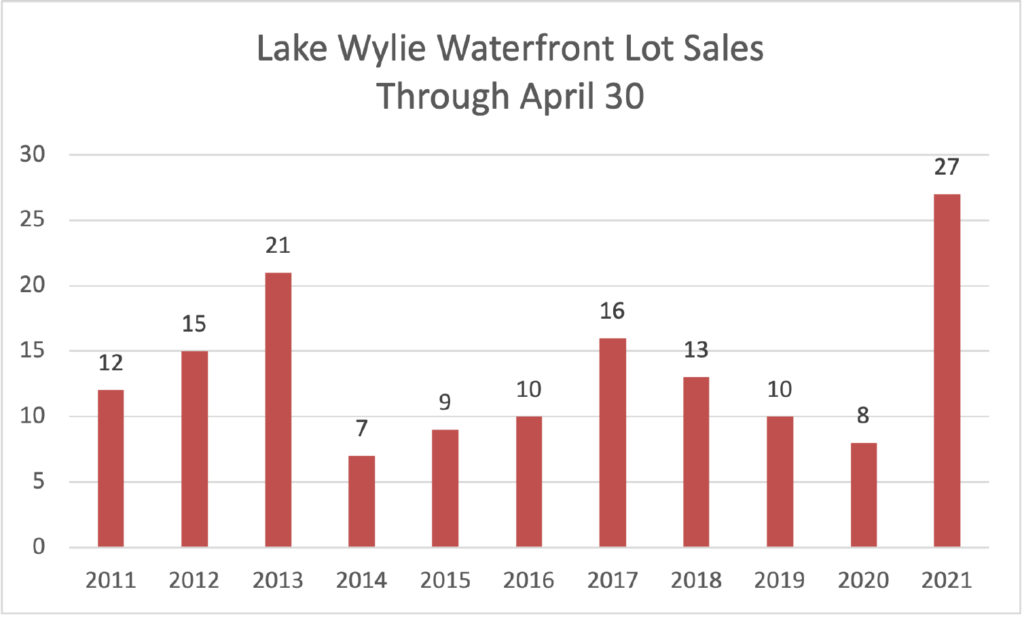
Waterfront lot sales are equally impressive this year:
In the chart above, lot sales through the end of April are reported for each year since 2011. This year, with 27 lots sold to date, we’ve achieved record levels. Twenty-one lots are currently under contract, which, if they all close, will bring us close to the total for all of 2020!
The average price is $343,000, an increase over last year’s total by 5%.
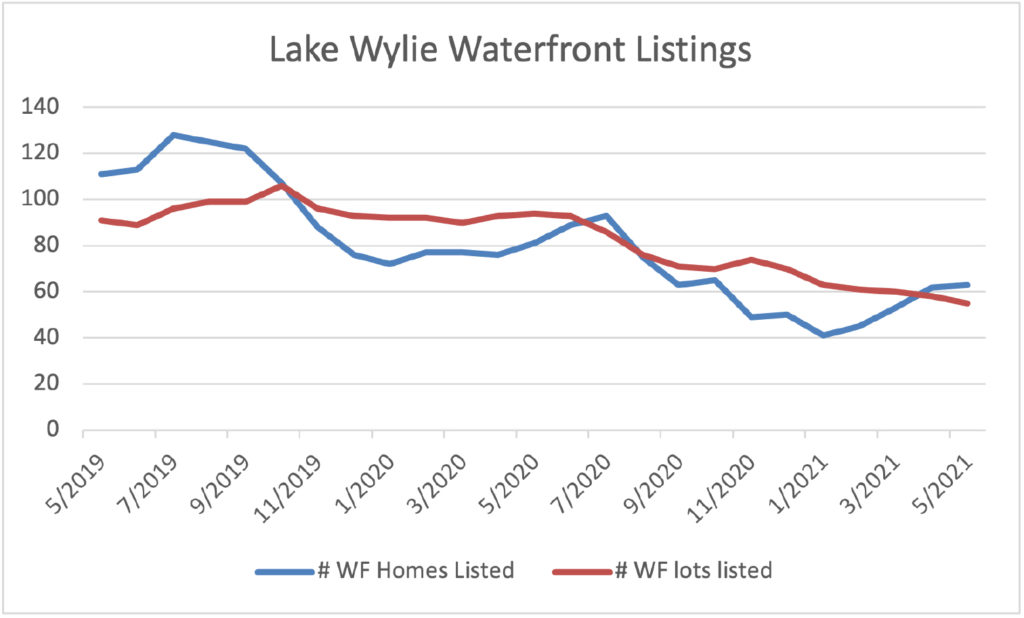
Listings for both lots and homes are very low:
In the chart above, listings by month over the past two years are shown for waterfront homes on Lake Wylie (blue line) and dockable waterfront lots (red line). While home listings have ticked up a bit in the past two months, that is typical for spring seasonality. Comparing listings for the first of May, our current home levels are down more than 20% from last year, and down 43% from two years ago.
The number of lots listed is down over 40% from last year and from the year before.
The Lake Wylie Man team is working with a number of buyers right now, at all price points, for both lots and land. We have sold more Lake Wylie property than any other realtor in the area, each year for over a decade. Buying and selling lake property involves different considerations than real estate transactions off the lake. Rely on The Lake Wylie Man for expert advice in pricing, marketing, and ensuring the closing is smooth.
To see details for recent sales, visit my web pages: Recent Waterfront Home Sales and Recent Waterfront Lot Sales.
Please call if you’d like to discuss your property. I look forward to hearing from you!
First quarter 2021 Waterfront Sales

If you (or anyone among your close friends/family) are in the market for a home, you know the current state of affairs. Homes are listed, and before you even have time to set up a showing, there are multiple offers on the home. The market is moving fast! I read this week about a listing in Washington, D.C. area that had over 80 offers — and 75 CASH offers — its first day on the market.

Nationwide, there is an inventory (number of listings) shortage, prices are rising, and the number of days on market is at record lows. Realtor.com’s March 2021 Housing data reported inventory at about half of last year’s levels and prices up 15.6%.

Closer to home, the same Realtor.com report listed the Charlotte metro area listings down 62.6% vs. a year ago, and the median listing price up 18.5%. No wonder buyers are feeling the squeeze!

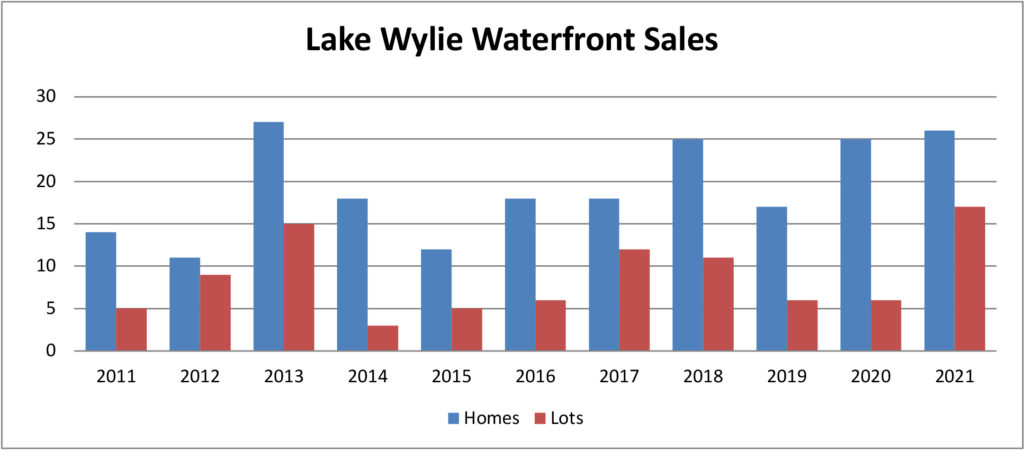
On Lake Wylie, first-quarter sales were strong for dockable lots and homes:

In the chart above, 1st quarter Lake Wylie sales are tracked with the blue bars representing the number of waterfront homes closed through the end of March each year, and the red bars representing the number of dockable lots. Both home sales and lot sales were up this year in comparison to last year, which is particularly notable considering the number of COVID-19 cases peaked December – February, when most of the offers would have been made on the homes that closed in the first quarter.
Dockable waterfront lot sales for the first quarter were at the highest point in a decade.
Looking at sales in the pipeline, there are 37 waterfront homes and 21 lots under contract — both about double the number under contract at the first of April last year.
At the same time the sales are heating up, the available inventory is continuing to diminish:

In the chart above, the blue line represents the number of Lake Wylie waterfront homes listed on the first of April each year, and the red line represents the number of dockable lots. Both have been on a steady decline over the past 5 years. The number of listings in the chart include properties under contract, so if the contracts hold, there are only 25 homes and 37 lots on the market currently without offers in place.
In first quarter, 65% of waterfront homes sold were on the market for less than a month — 42% for less than a WEEK. More than half sold for full asking price or better.
High demand and short supply mean one thing: Prices are going up. We see that happening on Lake Wylie:
The average price for a waterfront home on Lake Wylie is currently $885,000 — a whopping 18% increase over last year this time. Part of the increase is from a shift towards more expensive homes (eight $1million homes have sold in first quarter this year vs. six during the same time last year), and part is from price increases. 
 
Price-per-square-foot is a tricky measure for waterfront homes. A modest cabin on a spectacular lot can sell at a higher price-per-square-foot than a luxury home on the lake, for example. Also, the number of home sales on Lake Wylie are relatively low in a year, and definitely in a quarter. We typically don’t rely on price-per-square-foot for waterfront analysis.
 
However, across the larger Lake Wylie area, non-waterfront home price/square-foot spiked 14% over last year — a significant jump! Depending on area, condition of your home and amenities, you can expect to sell your waterfront property right now for an average of 10-15% more than you could pre-pandemic. 
 
Setting the right price in a market as volatile as this one takes knowledge and skill. The Lake Wylie Man team closed 42 waterfront transactions on Lake Wylie in 2020 (more than double any other Realtors), and has led the market for well over a decade. We know what sells, and for how much. We can advise you on what changes or updates you may consider for a faster and more profitable sale. We can market your home to buyers ready to purchase lakefront property. 
 
The sales outlook for 2021 is excellent — but we need more listings to keep the momentum strong!
 
If you’re a buyer (or have friends/family in the market), you can rely on The Lake Wylie Man team to advise the true value of a property. Our knowledge of the lake will ensure the best outcome, whether you’re buying or selling.
 
Check out Recent Waterfront Home Sales and Recent Lot Sales for details on closings in the past few months. If you have questions about this report or want to discuss your property, please call me. I look forward to hearing from you!
March 2021 – Waterfront real estate update

Spring fever is in the air! Some of these recent warm days have lured boaters out on the lake, and real estate activity is picking up considerably. Currently, there are 33 waterfront homes under contract (about 35%-45% higher than is typical for this time of year), and over half of those properties went under contract during their first month on market.

Vacant lots are also selling strongly — with 20 under contract right now. For perspective, a total of 50 dockable lots sold last year. At the beginning of March in 2020 (pre-pandemic) there were 10 dockable lots under contract — so pending sales are double what they were a year ago.

While all price points are in demand, luxury properties are continuing as the fastest growing segment. Year-end sales by price segment for waterfront homes on Lake Wylie in 2020 were as follows:

Under $500k – 23 homes (-12% vs. 2019)
$501k-$699k – 55 homes (+11% vs. 2019)
$700k-$999k – 53 homes (+20% vs. 2019)
$1million+ – 43 homes (+72% vs. 2019)

During January/February of 2021, 6 homes in the $1mm+ price category closed (as compared to 2 homes in 2019), and there are 11 homes in that price category under contract. Typically, first quarter represents under 20% of annual sales — so early 2021 activity indicates a very strong start for luxury home sales.

Higher priced waterfront lots are selling strongly as well. Thus far in 2021, 8 dockable lots have closed on Lake Wylie (up slightly from the past 2 years), and 6 of those lots sold for over $300,000. One, a 3.1 acre point lot in McLean, sold for a head-turning $1.3 million. There are currently 20 dockable lots under contract, the highest number we’ve seen in years.

Waterfront sales usually start taking off in March and build through the summer and into early fall. This year, February sales jumpstarted the season, outperforming the past 4-year average:

In the chart above, the blue line represents the past 4-year average number of waterfront homes sold on Lake Wylie by month, and the red line represents 2021 sales. Based on sales-to-date and pending properties, we can expect first quarter to significantly outperform 2020 levels.

Available inventory (number of listings) on Lake Wylie is still critically low. Not including listings that are under contract, there are only 21 waterfront homes on Lake Wylie available to buyers — about a third of the number available last year. The number of waterfront lot listings are down considerably as well. Low supply and high demand continue to cause prices to inch up on waterfront property.

Check out my webpages, Recent Waterfront Home Sales and Recent Waterfront Lot Sales, to see details of properties sold in the past few months.

Please call if you have any questions or wish to discuss your home or land. In this bullish market, rely on the expertise of the Lake Wylie Man team to price and position your property for the most positive outcome.