In spite of our tumultuous times, the real estate market on Lake Wylie had a historically successful year, breaking sales records and ending the year strong. For sellers, the metrics are all encouraging: prices on the rise, properties selling quickly, and demand that far outpaces supply. For buyers, low mortgage rates are enticing, but tight supply means there is heavy competition for new listings, and buyers need to be ready to act quickly.
Topline Sales Summary
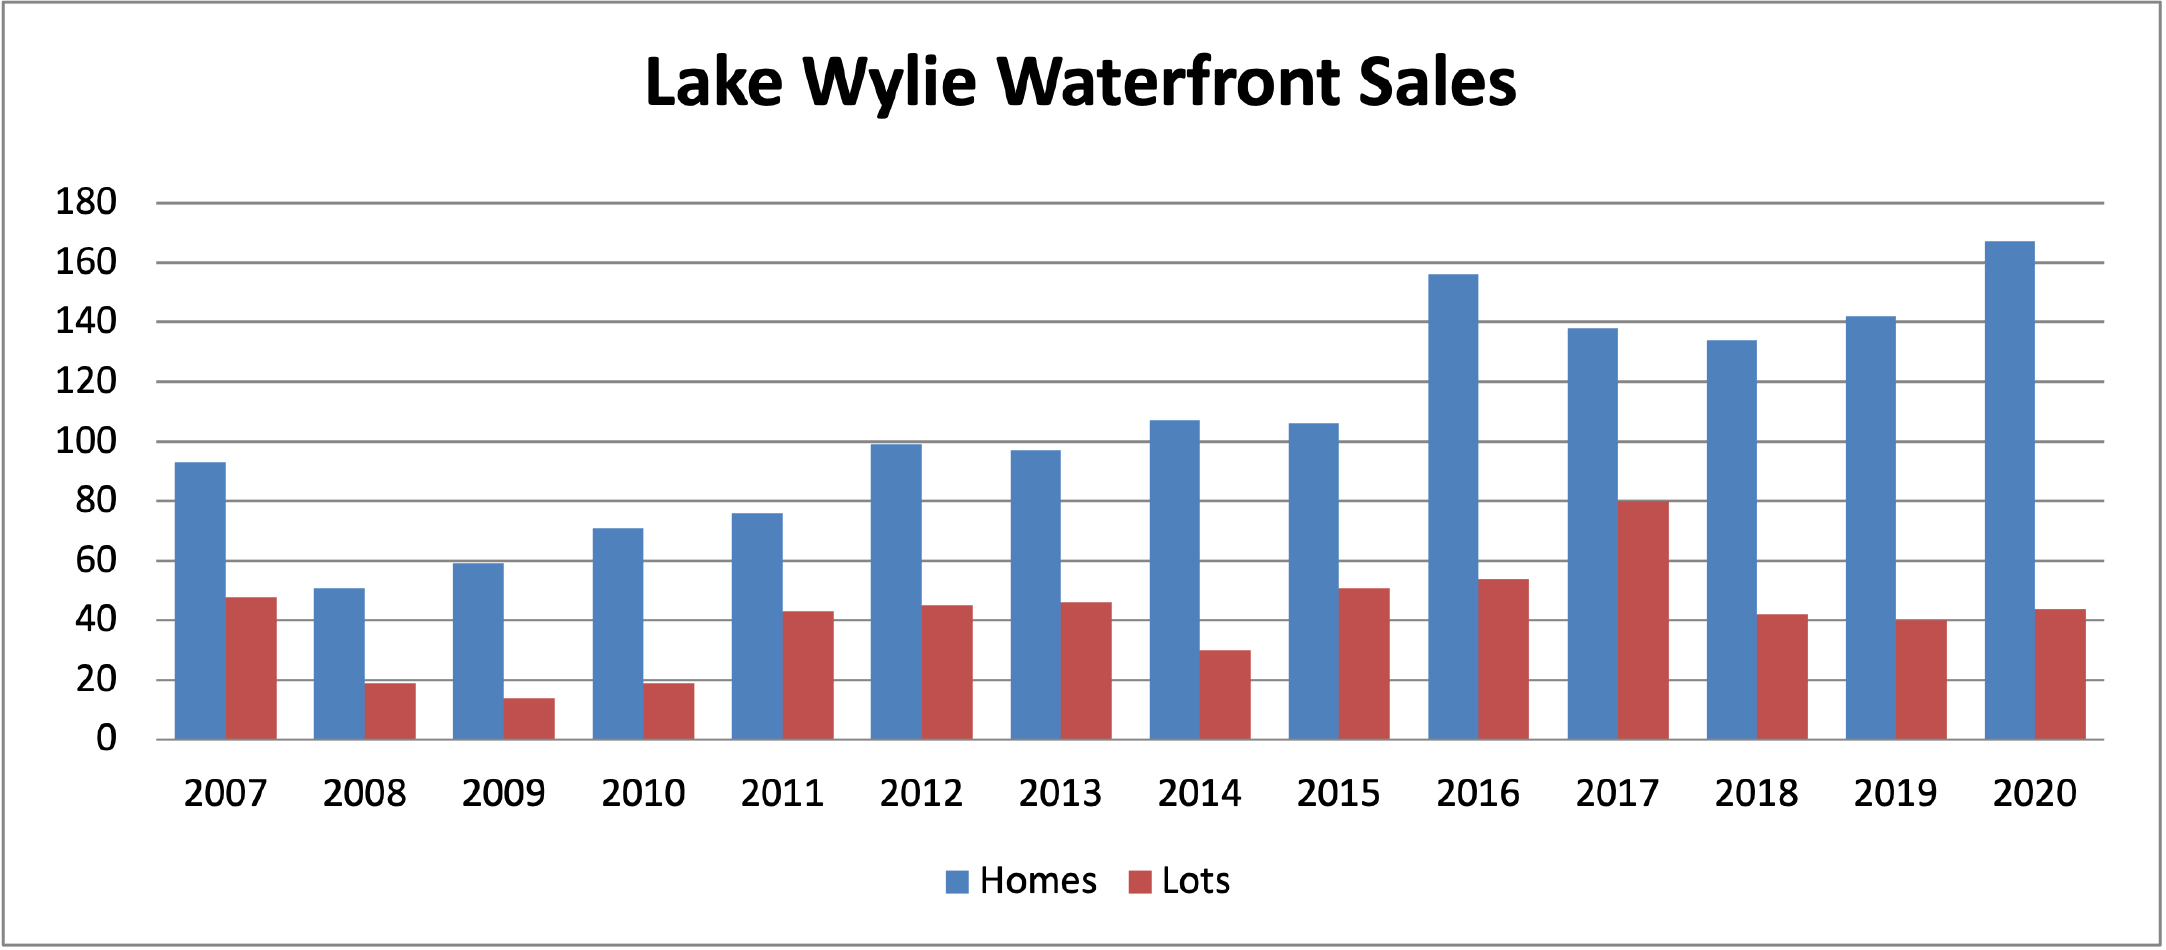
Waterfront home sales (blue bar) reached record levels in 2020, with 167 sales, an 18% increase over 2019. Dockable waterfront lot sales totaled 44, a 10% rise over previous year.
The market has been very strong since 2016. Currently there are 14 homes and 13 dockable lots under contract, painting a positive picture going into 2021.
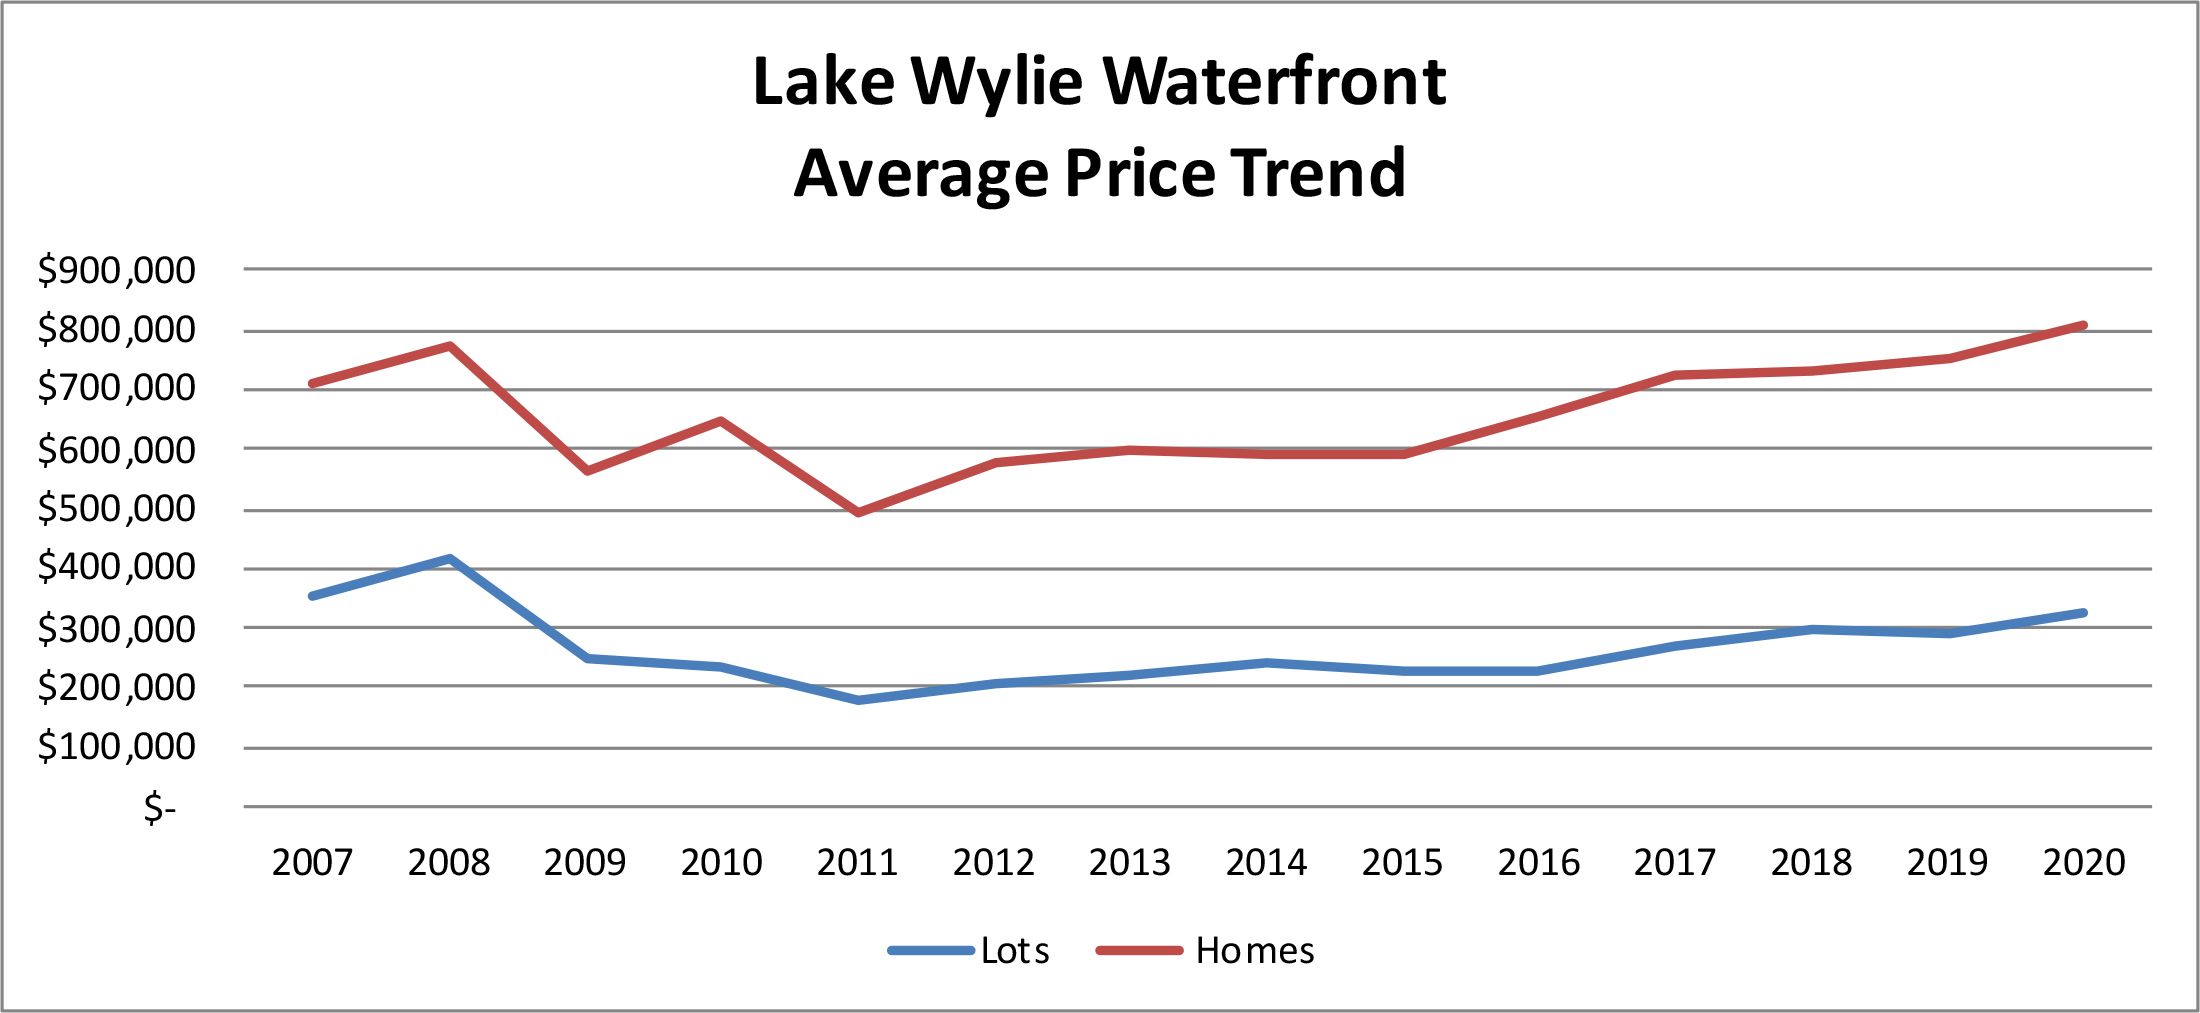
Average prices are climbing significantly. In 2020, the average home price (represented by the red line) rose to $805,000 – a $50k jump over 2019 average prices. The average dockable lot price rose to $325,000.
Sales by month in 2020 reflected the unusual nature of the year:
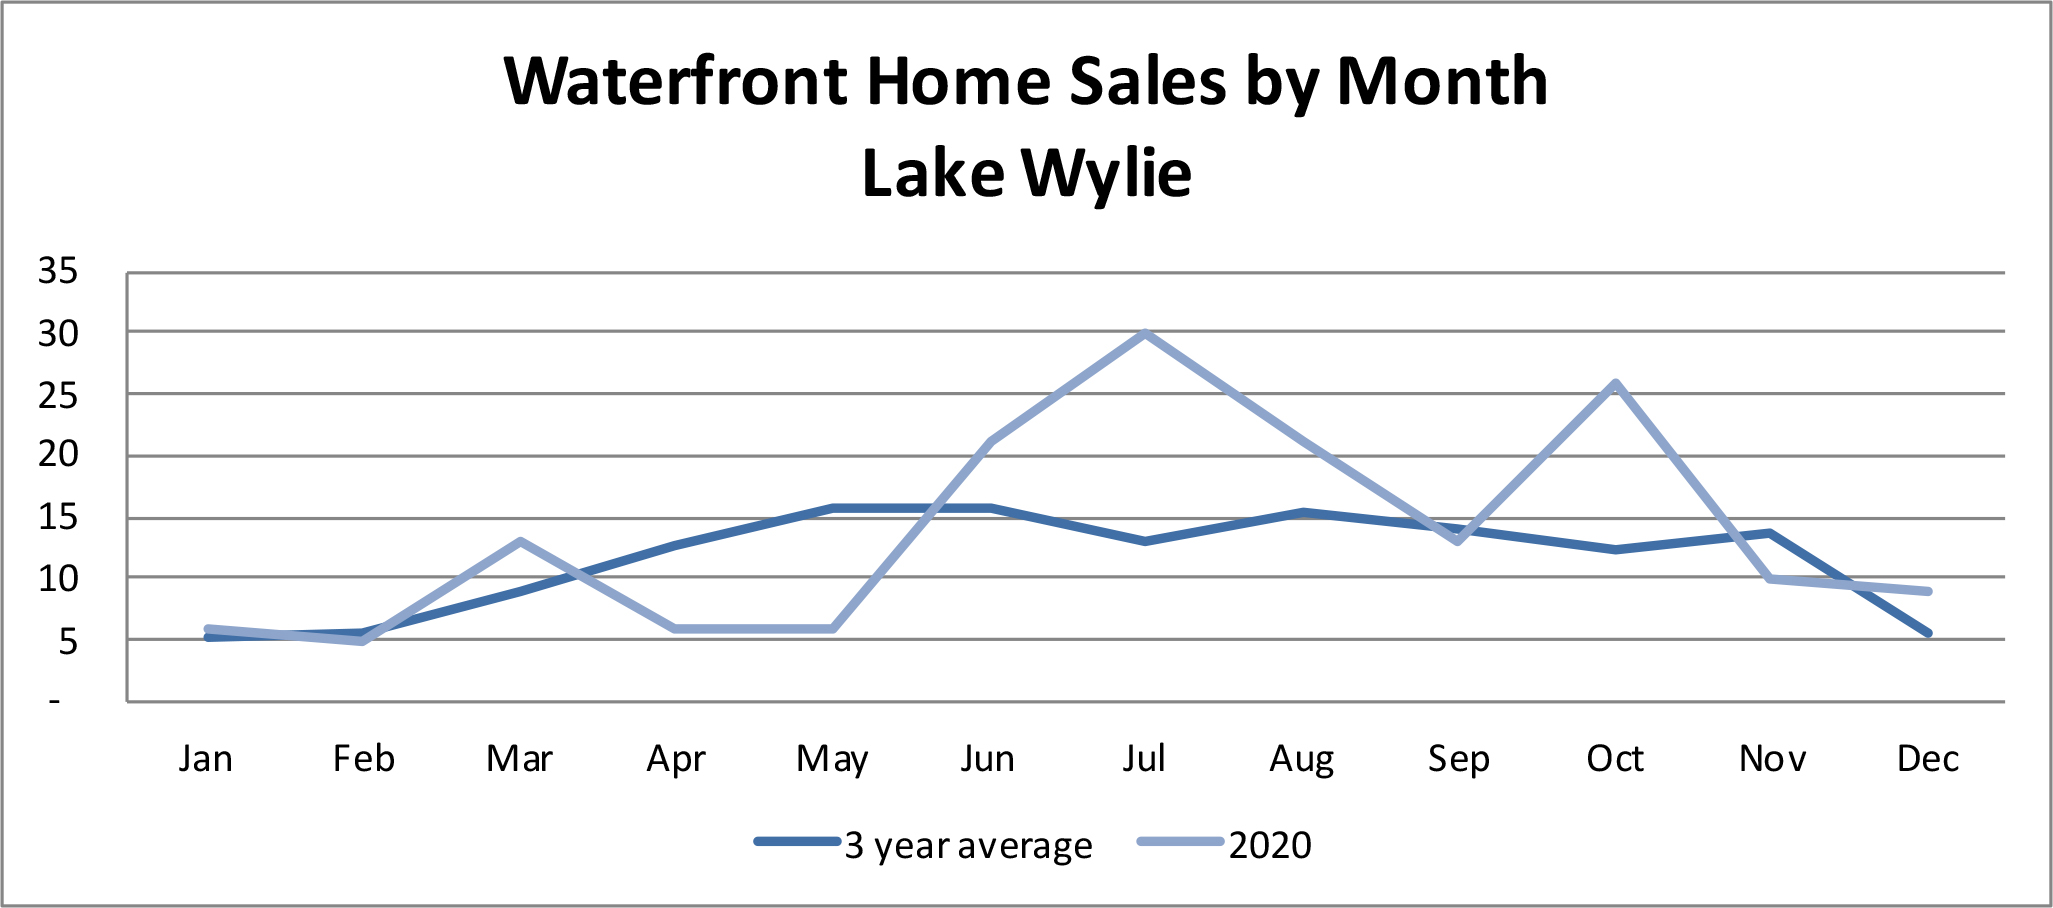
In the chart above, the dark blue line represents the past 3-year average number of waterfront home sales on Lake Wylie, while the grey line represents number of lake homes sold in 2020. Considering homes usually take 6-8 weeks to close, the “sales” chart generally lags buyer activity (purchase contracts) by 1.5-2 months.
First quarter sales were “normal,” but as the pandemic hit in early March, the initial impact was evident in April/May. Stay-at-home orders and real estate showing limitations slowed the market initially, but then sales recovered — and even took off — on the lake as people began changing their lifestyles.
Lake Wylie, as well as many resort towns, experienced higher demand for housing as buyers began to put more emphasis on outdoor recreation, suburban or rural locations, and home-oriented settings to work and relax.
Supply side
Probably the most extraordinary consideration about the record sales is they occurred in a time of record low inventory for both waterfront homes and land on Lake Wylie:
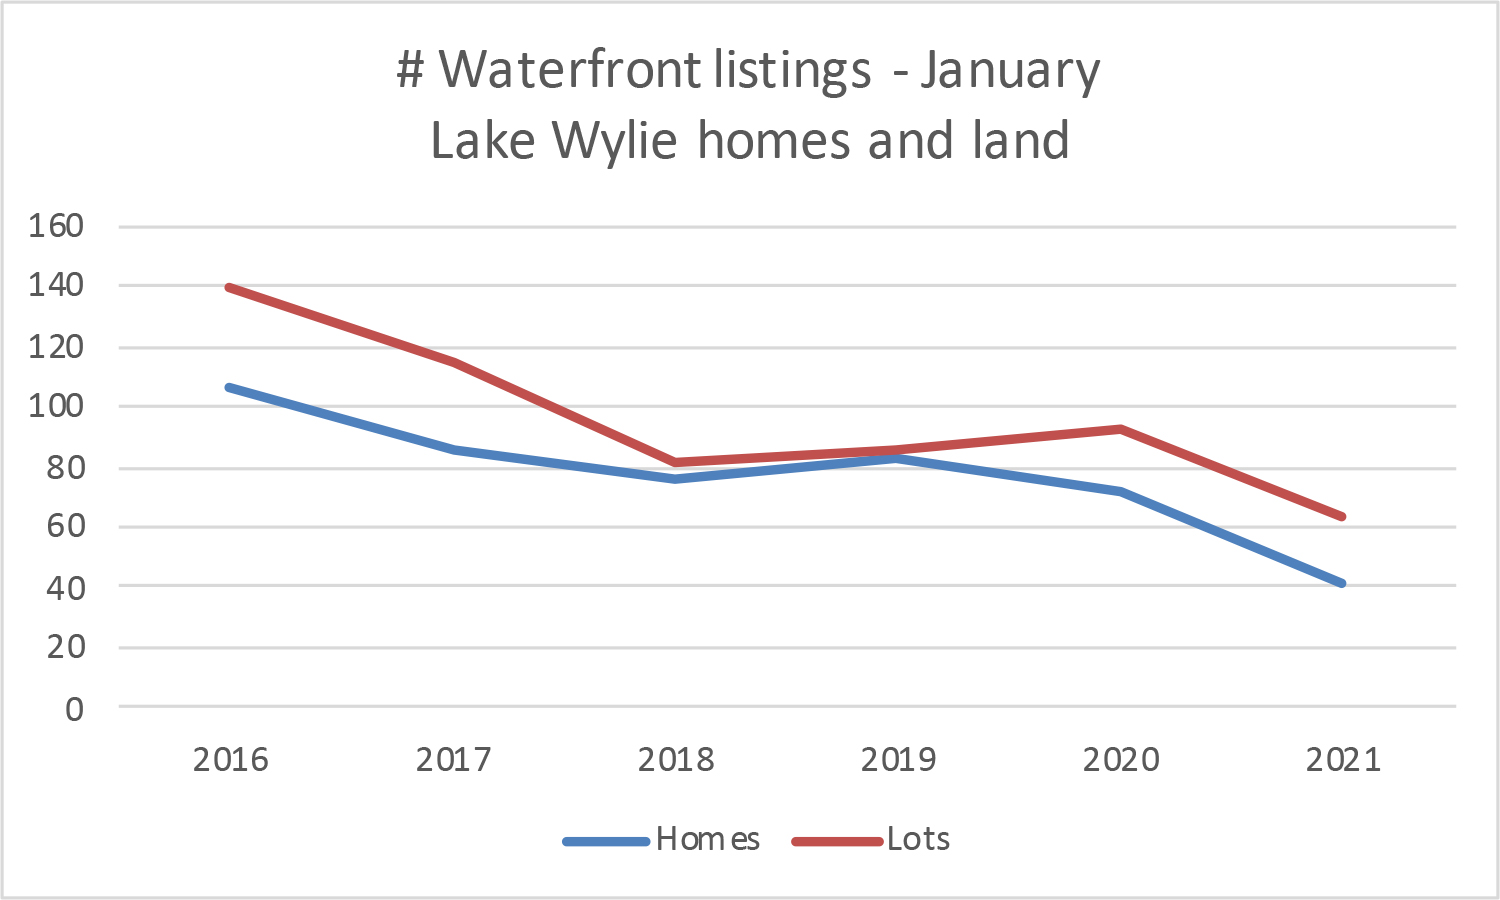
In the chart above, the blue line represents number of waterfront home listings (including properties currently under contract), and the red line represents waterfront lot listings on Lake Wylie. Typically, the lowest point of listings is reached in the winter months of each year, but the current inventory levels are nothing short of dire.
During the recession years (late 2007-2009, inventory levels were at record highs. Demand for properties was far less than supply. That began to shift about 5 years ago, and reached critical points in 2020.
As of the first of the year, there were only 41 listings for Lake Wylie waterfront homes, and 63 listings for dockable lots. Of the 41 homes, 14 are under contract.
Also, the home listings include 15 properties that are “proposed construction.” While these appear as home listings, they are actually waterfront lots paired with sample house plans, either planned by builders or provided simply as an idea of a home that will fit on the lot within the neighborhood. A few more listings are homes under active construction, but not yet complete.
The low supply of waterfront property has a profound impact on the market. New listings receive immediate attention from buyers, and if the price is right and the location and condition of the home are desirable, quick sales are common, many with multiple offers. In 2020, over 40% of sales contracts were written within the first month of listing.
Sales by Segment
With record high demand and record low inventory, the make-up of sales was bound to shift. Historically, supply has been highest relative to demand in the luxury $1 million+ segment. In 2020, buyers with bigger wallets came to market, and we had the highest number of luxury sales of any year, with 42 homes selling for $1 million plus. That blew away the past record of 25 homes sold in that price segment in 2019.
Here is how the sales shifted by price segment:
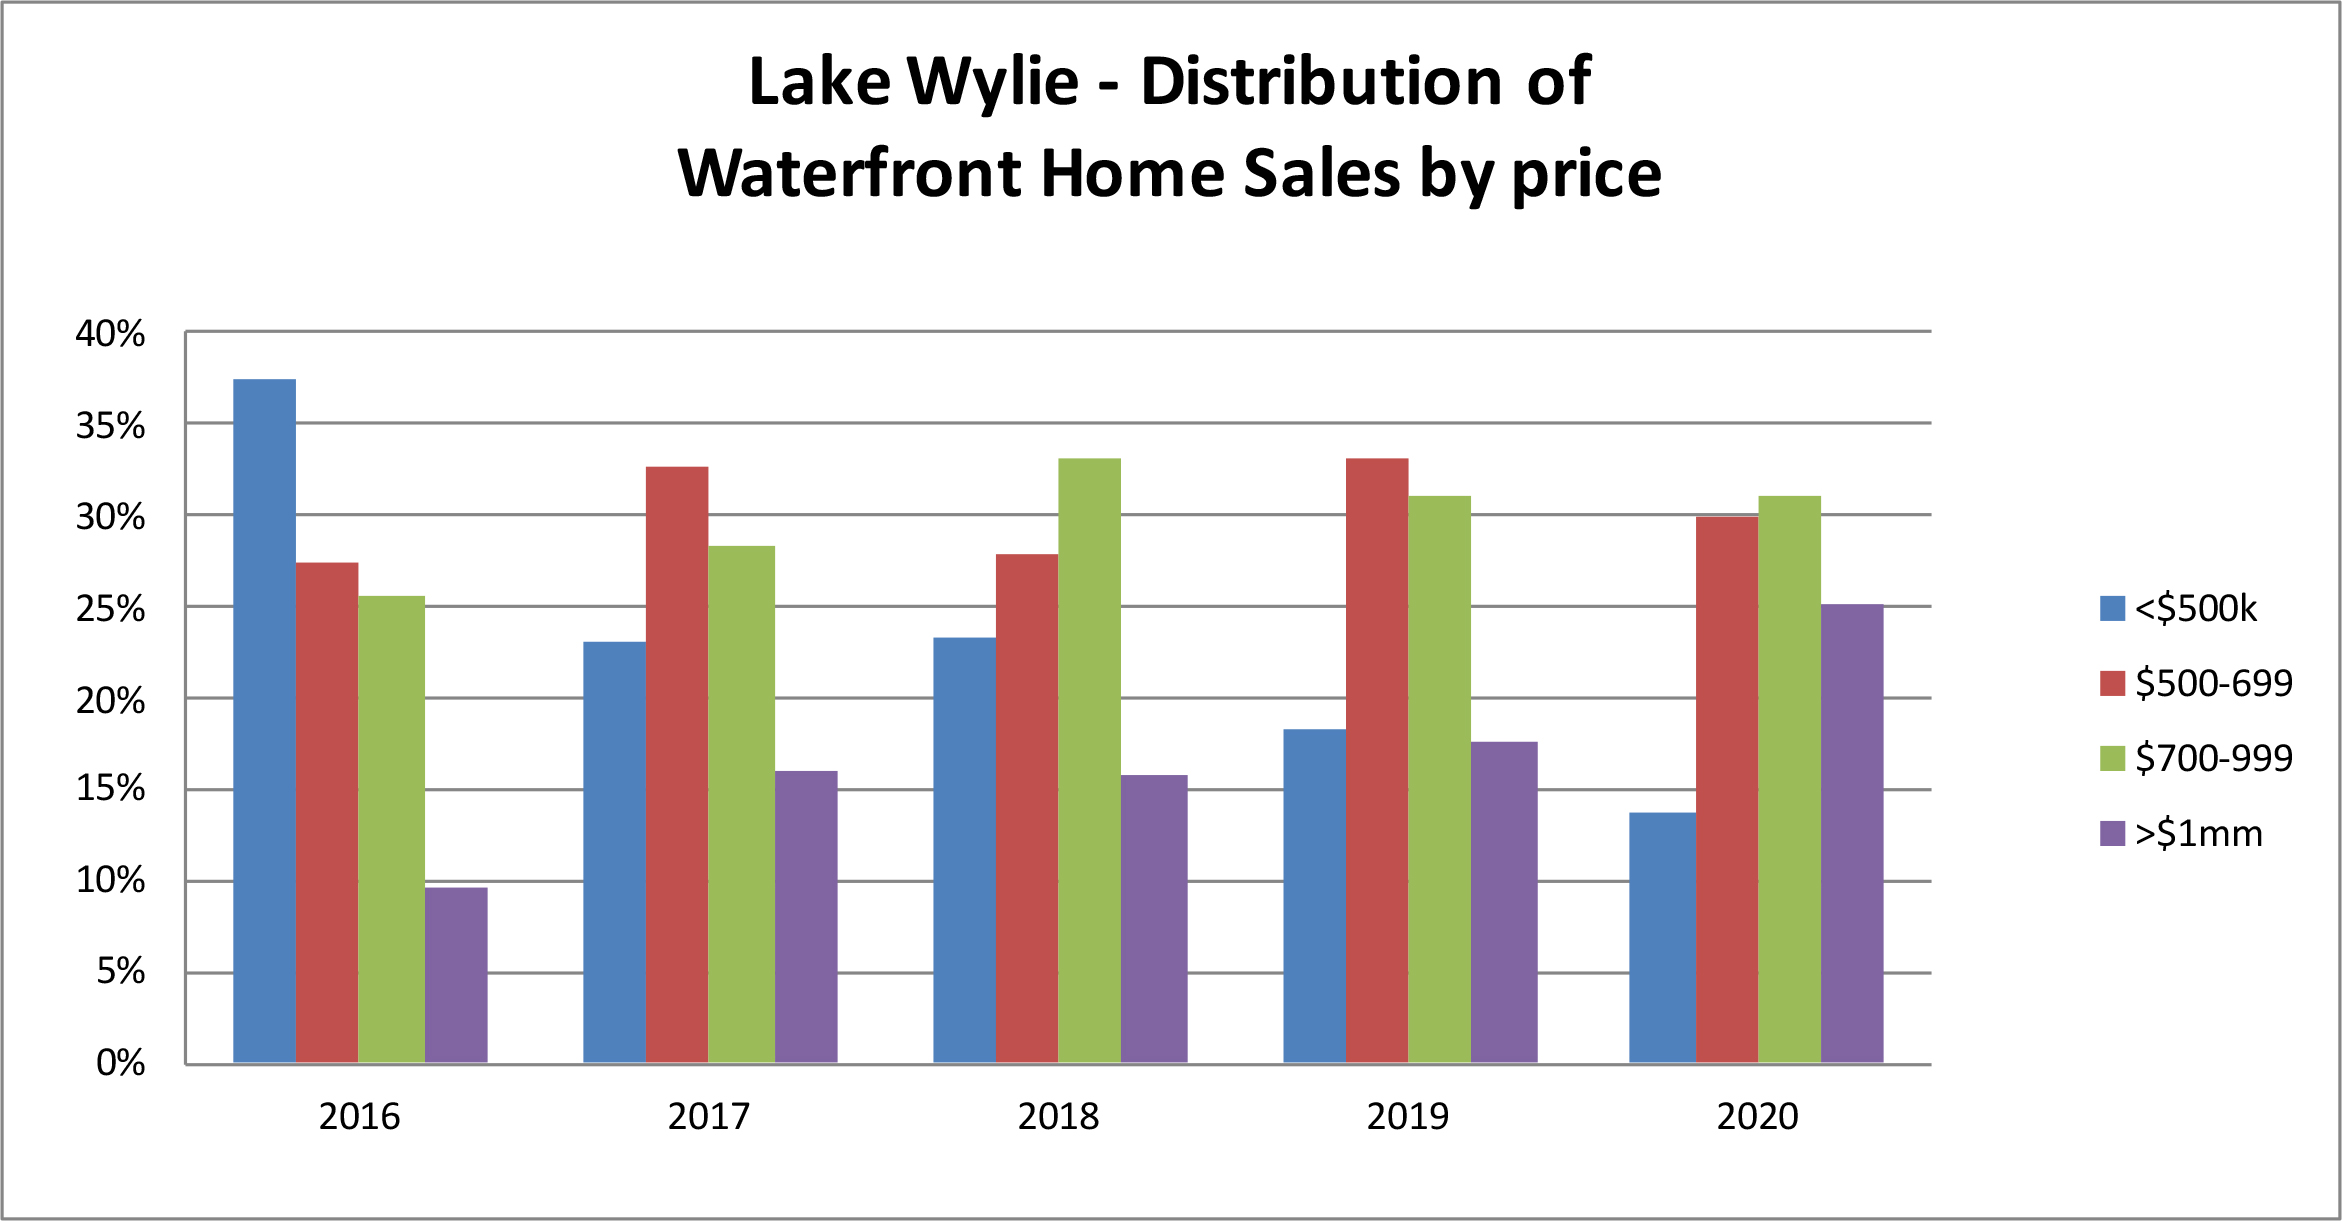
In the chart above, for each year the blue bar represents share of homes sold for under $500k, the red bar represents $500k-$699k, the green is $700k-$999k, and the purple represents $1 million+ priced homes. The chart depicts SHARE of sales, so each year totals 100%.
We see in 2020 the higher priced homes claimed a bigger piece of the sales pie, with 25% of sales at $1 million plus and another 31% in the $700-$999k segment.
The under $500k segment, which claimed 38% of sales just five years ago, represented only 14% of 2020 sales.
One portion of the lower priced properties is what we refer to as “cabins,” typically older lake properties (built before 1970), smaller structures intended for weekend/2nd home use. Over the years, these structures have either fallen into disrepair or are outdated — thus are sold for land value only — or are remodeled and updated for weekend use.
Cabin sales were very strong in 2020:

In the chart above, the blue bar represents number of “cabins” sold — 19. Supply of these properties can vary greatly year-to-year, but when available, sell very well.
The red line, on a separate axis (see right side of the chart) represents the price trend. Not surprisingly, the prices for cabins has been on the rise over the past few years. Some of that can be attributed to renovations, some can be attributed to increased demand.
The average price for cabin properties on Lake Wylie rose to almost $440,000. The average size of the cabin was 1,179 square feet. Often times cabins are located on premium waterfront lots, with nice views — which impacts the price. The potential use of the property also comes into play when pricing a cabin. Predating our current shoreline restrictions on Lake Wylie, some cabin properties can be used as a future building site for a larger home, but some cannot. A Lake Wylie expert (e.g. The Lake Wylie Man!!) can advise potential sellers and buyers on these very important considerations.
Geographic Sales on Lake Wylie
Lake Wylie is different than many lakes in that it is located in 2 states and 3 counties, with different regulations and considerations for each area.
In 2020, sales for waterfront homes by area were as follows:
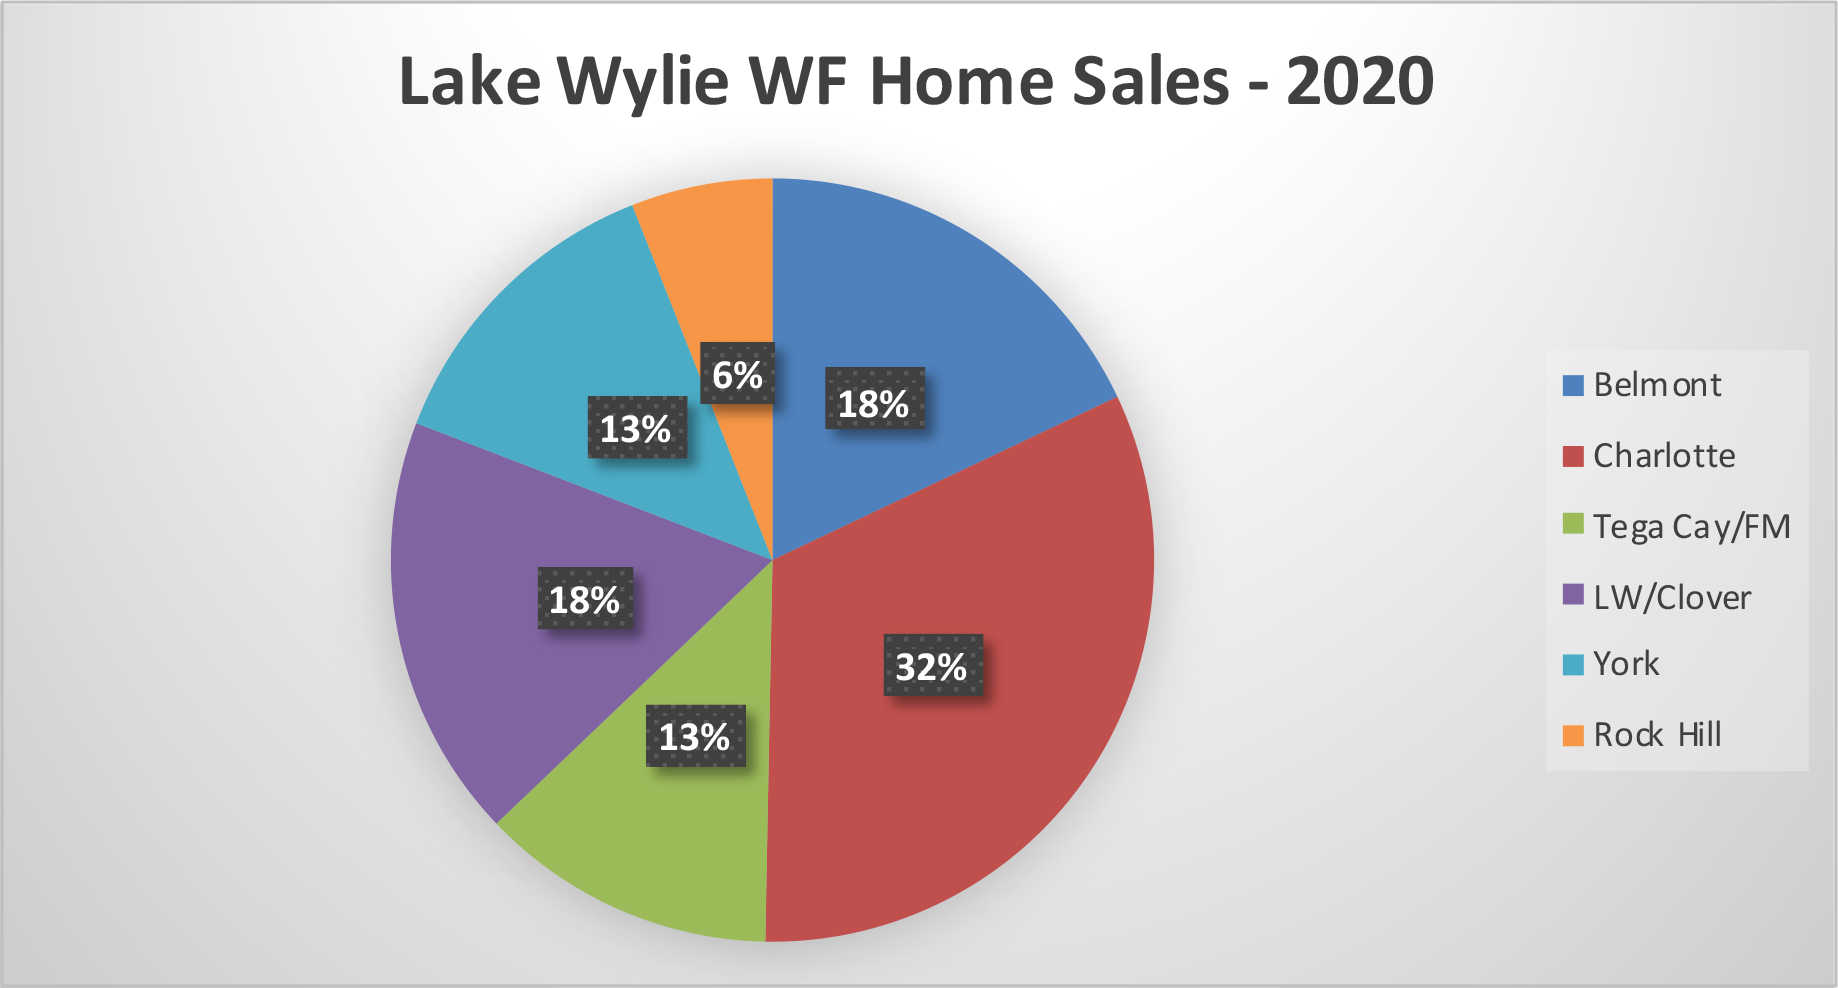
The sales were split evenly by state in 2020, with half in NC (Belmont & Charlotte) and half in SC. The highest average price was in York, at $925,000. The lowest average price was in Tega Cay/Fort Mill, at just under $725,000.
Compared to 2019, Charlotte had the largest gain in sales in 2020, increasing to 32% share of the market from 21% share a year ago. Tega Cay, Lake Wylie and Rock HIll all dropped in share. However, 2020 was a year heavily driven by supply. With such low supply (listing) levels across the board, some buyers bought what was available, even if the location wasn’t necessarily their first choice.
With 2020 being such a very strange year, we have to be careful in making assumptions of trends based on activity during the year!
Waterfront lot sales (dockable) broke out as follows:
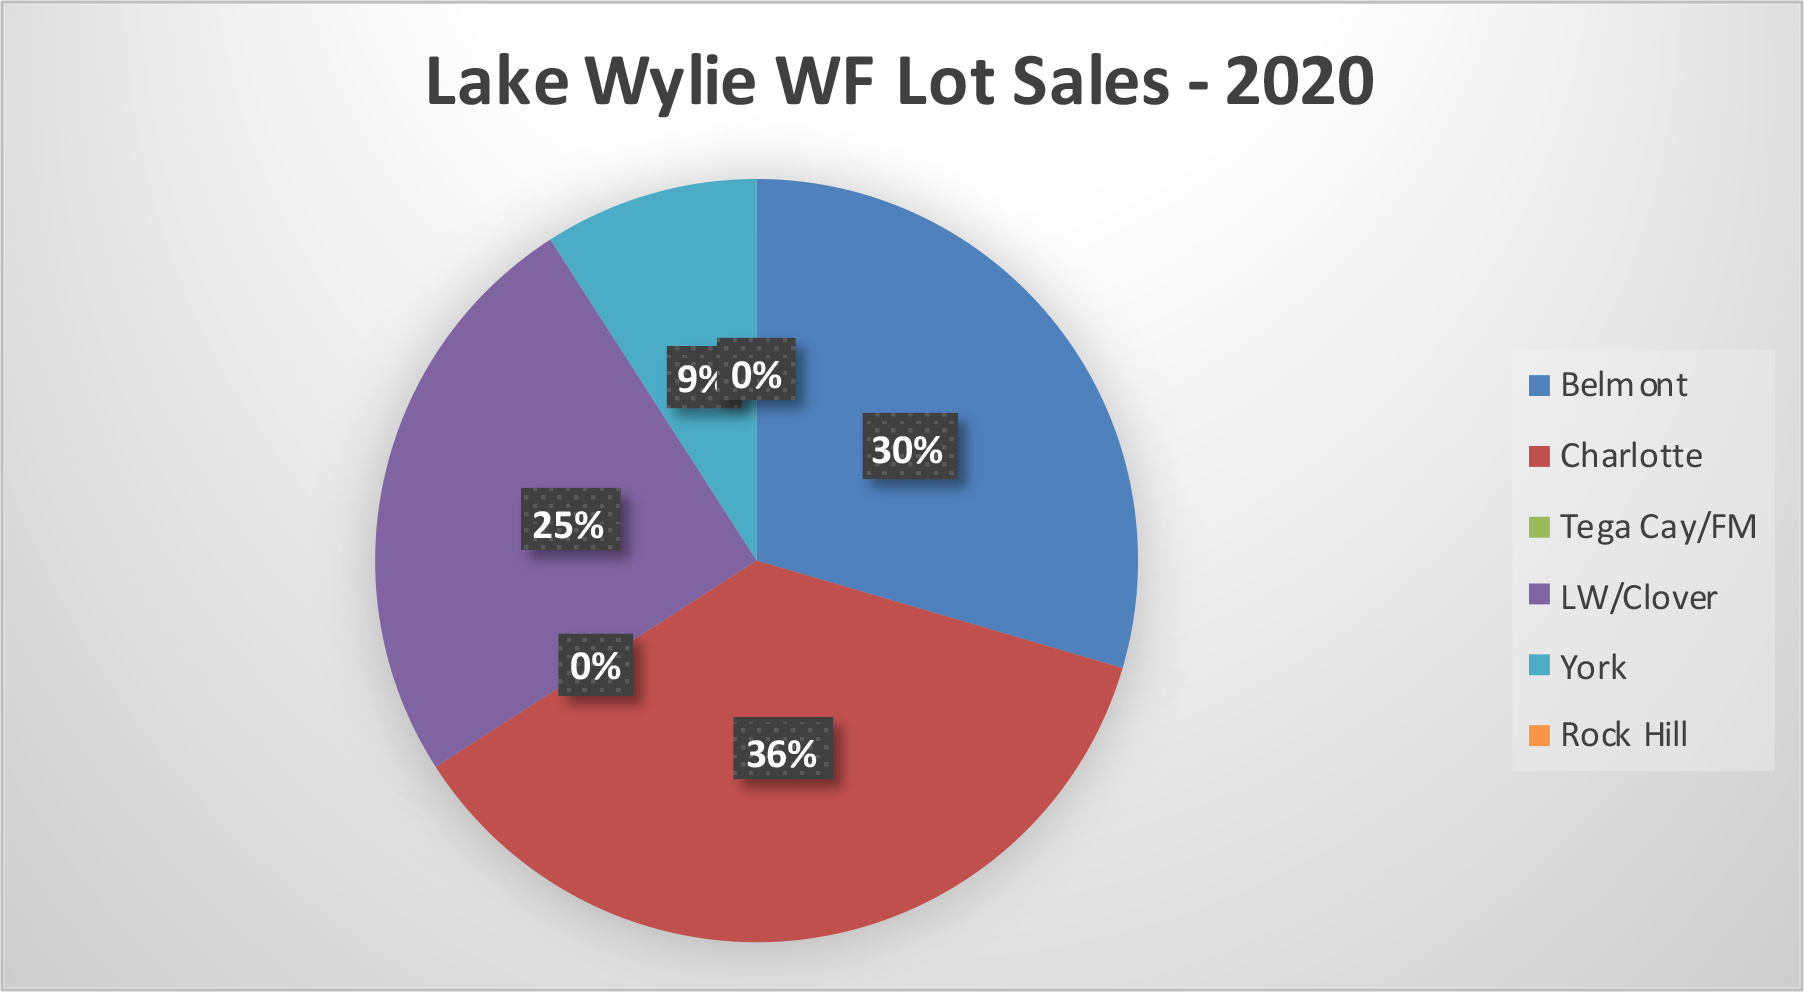
There were no dockable lots sold in Rock HIll or Tega Cay — the most developed parts of the lake, where little raw land still exists.
Charlotte and Belmont represent the bulk of land sales in 2020. In Charlotte, there were several sales in The Sanctuary, which pulled up average price considering the high acreage tracts. There were also a number of sales in the Palisades area.
In Belmont, sales were scattered in Reflection Pointe, McLean, and a few in other neighborhoods such as Misty Waters, Woodland Bay, and others.