Jan Todd
History of Lake Wylie
History of Lake Wylie
Until the early 1900’s, the area now known as Lake Wylie was part of the 224 mile Catawba River. The river was an important resource — once the lifeblood of the Catawba (“river-people”) and other Sioux tribes. Later the river sustained the Europeans who settled and planted near its banks.
However, the river was flood-prone, shoal-filled, and dotted with waterfalls — too turbulent to permit the kind of water traffic that could have truly made it a formidable industrial presence.
Dr. Gil Wylie
In the early 1900’s, Dr. Walker Gil Wylie — a well-respected New York physician and former resident of Chester, S.C. — recognized the potential of the river. In addition to his extensive medical experience, Dr. Wylie had an engineering background — which spurred his interest in doing something about the stagnant industrial situation of the area around his hometown.
A graduate engineer from the University of South Carolina, William C. Whitneer, joined with Dr. Wylie and others to build a dam and an experimental hydroelectric plant in Anderson, S.C. Following the success of this venture, Dr. Wylie and his brother created the Catawba Power Company in 1900, and began work on a dam near Fort Mill, SC.
The dam was completed in 1904 and the lake that resulted was christened “Catawba Lake.” In 1924, the dam was rebuilt, bringing the lake’s surface to over 13 thousand acres and 325 miles of shoreline. In 1960, the lake was renamed to honor the Dr. Wylie.
Lake Wylie became one of eleven lakes in the Catawba River chain. Electric power — supplied by what now is Duke Energy — completely transformed the area, carrying the local textile mills into their golden age, bringing people, roads, and prosperity.
Today, Lake Wylie continues to be a major energy center supporting the Wylie Hydroelectric Station, Allen Steam Station and the Catawba Nuclear Station (pictured above). The lake also serves as a water supply for Rock Hill, S.C. and Belmont, NC.
While the Lake Wylie area is no longer the untamed, natural wilderness of the days of the Catawba tribe, it remains a place of beauty and growth. Beautiful homes grace the waterfront. Duke Power provides six public boat access areas. Residents enjoy the fishing, camping, and restaurants around the lake.
What can my money buy on Lake Wylie?
- Under $500k: Approximately 1,550 square feet in size, 46 years old.
- $500k-$699k: Approximately 2,500 square feet in size, 31 years old.
- $700k-$999k: Approximately 3,950 square feet in size, 21 years old.
- $1MM + : Approximately 5,150 square feet in size, 16 years old.
Lake Wylie Waterfront Sales – Year End Review
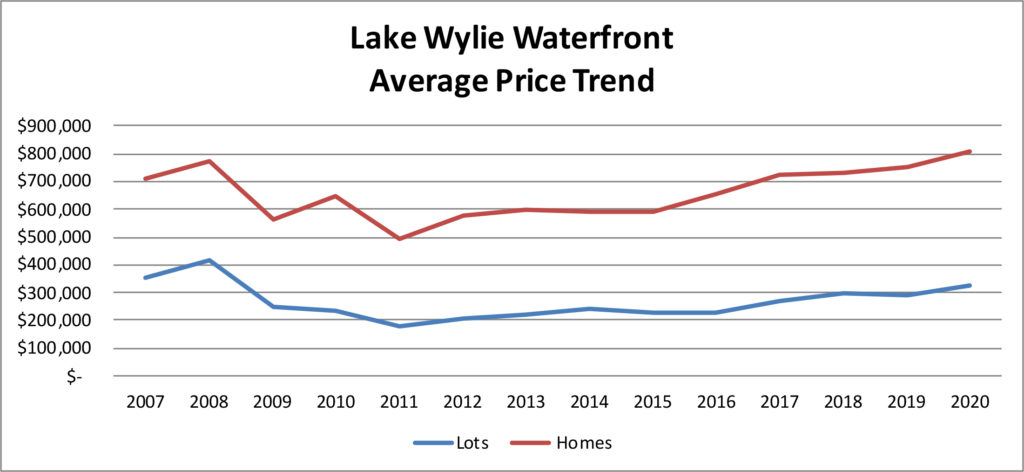
Average prices are climbing significantly. In 2020, the average home price (represented by the red line) rose to $805,000 – a $50k jump over 2019 average prices. The average dockable lot price rose to $325,000.
Sales by month in 2020 reflected the unusual nature of the year:
Winter Waterfront Market
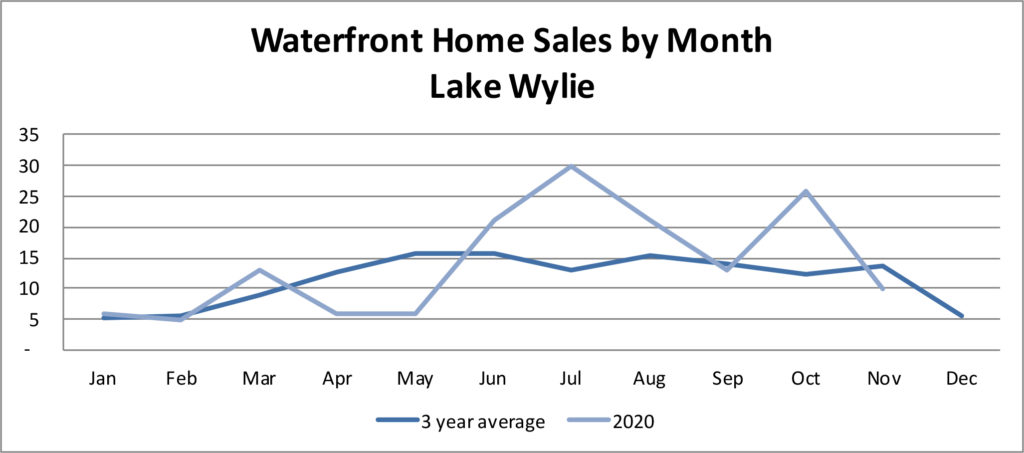
Well folks, we’ve almost made it through 2020, and for a year with the same moniker as perfect vision, there were a lot of things we didn’t see coming. Case in point: in a year when we struggled with tight inventory, never seeming to have enough waterfront homes available for sale, we’ve already surpassed the sales record on Lake Wylie!
Yep, as of November 30, 158 dockable waterfront home have closed so far this year, exceeding the record of 156 in the full year of 2016. There is more to come this year, of course, with 19 homes currently under contract, some of which will close in December.
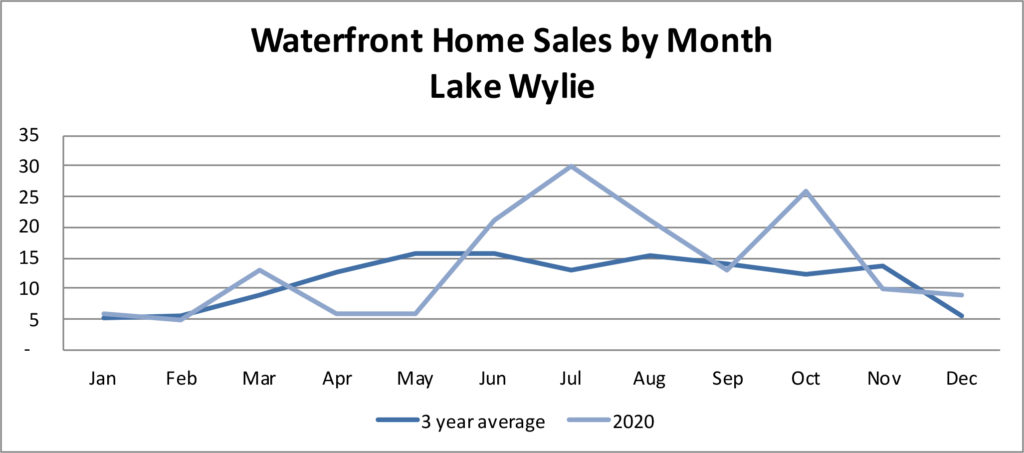
Check out the monthly waterfront home sales in comparison to the past 3-year average:
A roller-coaster ride in real estate – November 2020
October numbers are in for Lake Wylie real estate activity, and It has certainly been a roller coaster ride!
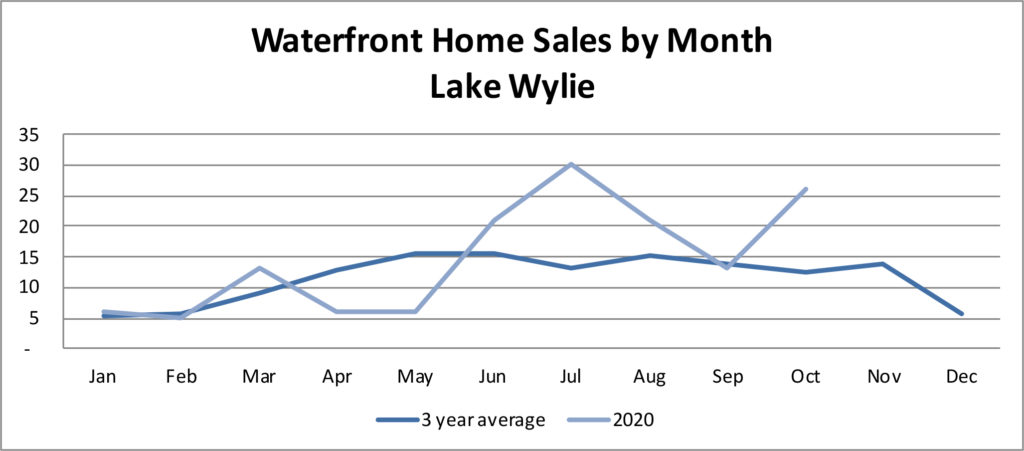
TWENTY-SIX waterfront homes closed in October — a month that usually averages 8-10 closings. Last year the market had a record-breaking October, with 16 closings. Check out this year’s performance in comparison to the past 3-year average:
3rd Quarter Update – Lake Wylie Real Estate
Hope everyone is enjoying these crisp autumn mornings! It is one of my favorite times to be out on the lake, and I’m looking forward to watching the fall colors reflecting on the water.
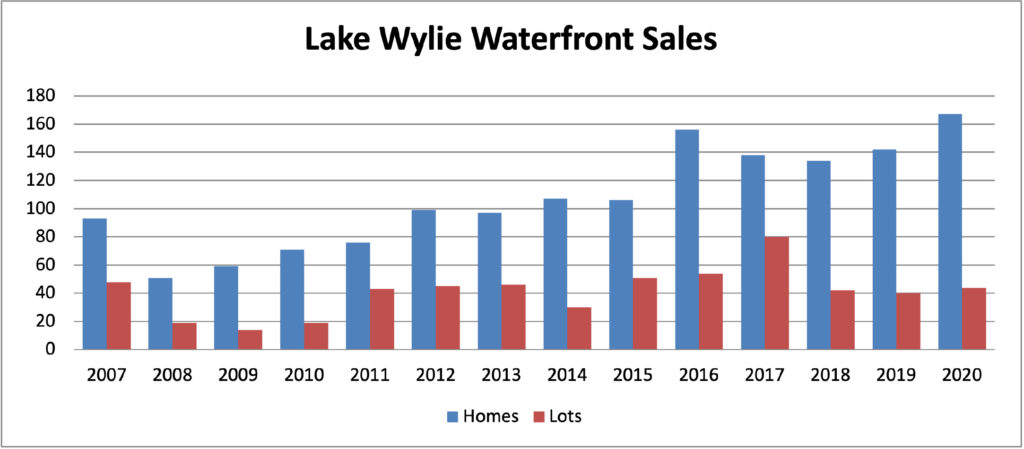
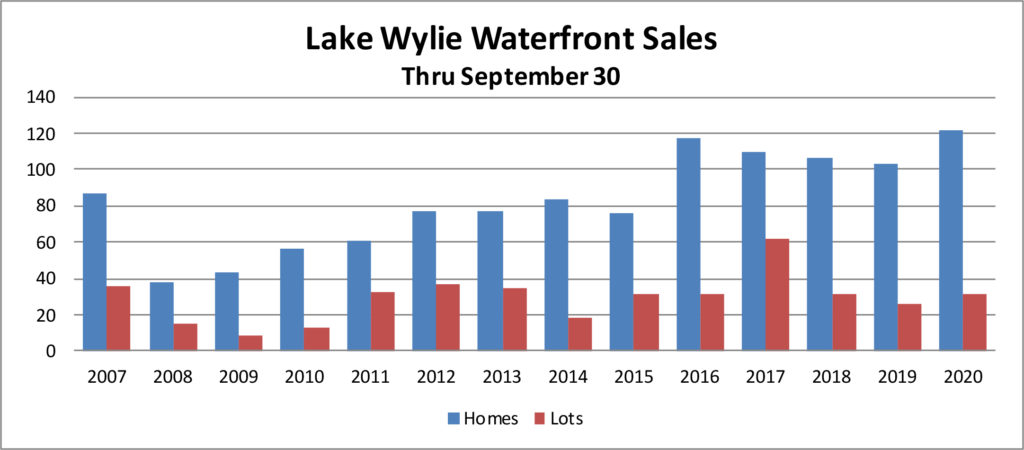
We’ve just wrapped up the third quarter of 2020, and we’re headed towards a record setting sales year on the lake. In September, 13 waterfront homes and 5 dockable lots closed on Lake Wylie. Lot sales are keeping pace with the past couple of years, and home sales are soaring to a new year-to-date high:
In the chart above, the blue bars represent the number of waterfront home closings through September of each year since 2007; the red bars represent the number of dockable lot sales.
As of the end of September, waterfront home sales total 122, and there are currently 38 under contract — putting us on track to have a record sales year on Lake Wylie. Waterfront lot sales are also expected to finish strong, with 32 lots sold to date and 14 currently under contract.
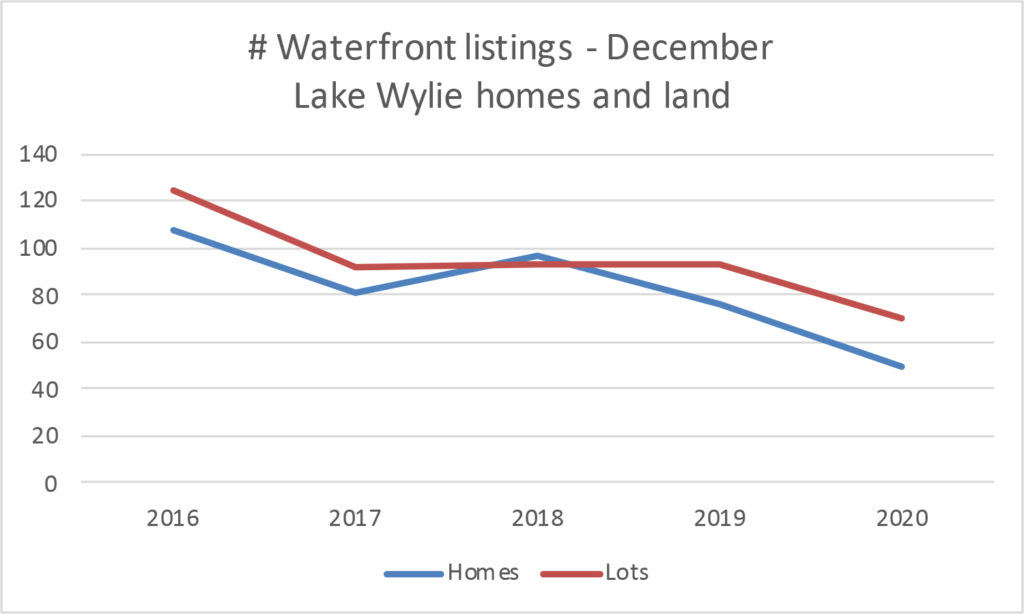
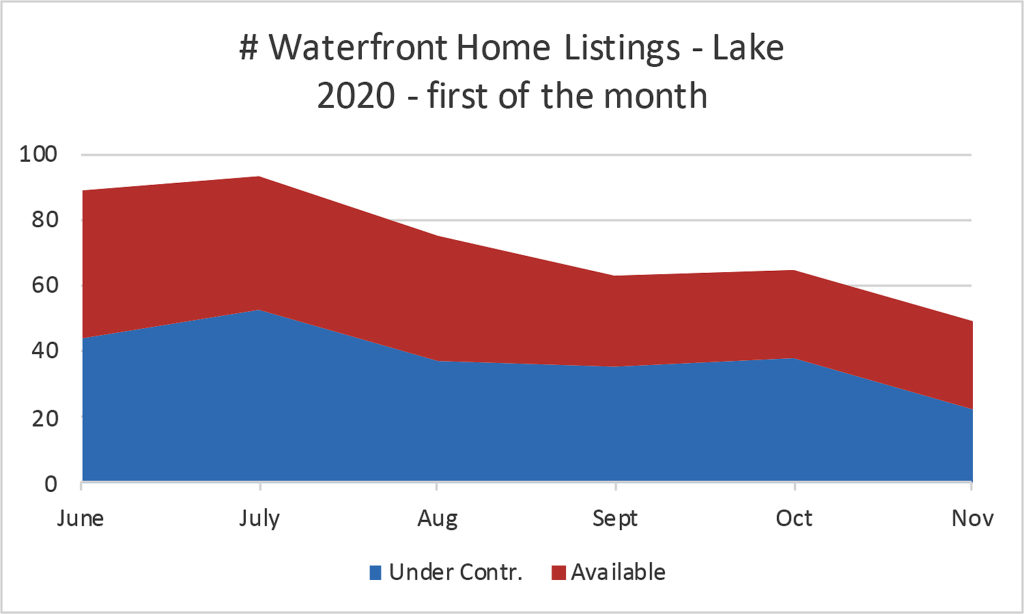
However, the number of listings are at a RECORD LOW. There are only 65 waterfront homes currently on the market, and with the large number that are under contract, there are only 27 available. In September, over half of the homes that closed were on the market for less than a week. New listings are being snatched up by eager buyers, many with multiple offers and sales at or above asking price.
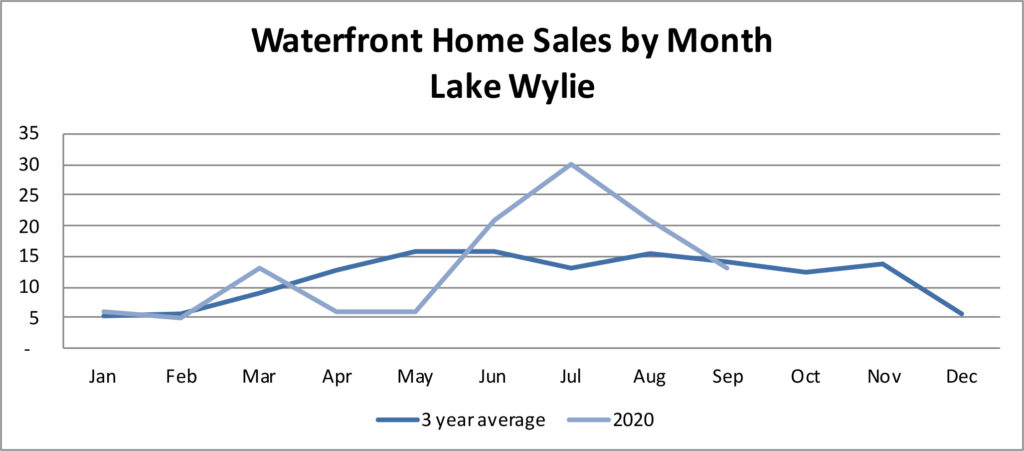
Typically, sales begin to drop off as the summer ends, as illustrated in the chart below:
Above, the dark blue line represents average sales for Lake Wylie waterfront homes over the past three years (2017-2019), and the light blue line represents home closings per month in 2020. Closings dropped in the early days of the pandemic, but recovered in June and continued at a strong pace.
With the number of homes currently under contract, we expect 4th quarter sales to exceed the 3-year average, especially if additional homes are listed during that time. With pent-up buyer demand, it is an excellent time to be in the seller’s shoes.
Waterfront lots, too, are in demand this year. Inventory is at a low point, with only 70 dockable lots currently on the market, and with 14 under contract, there are just 56 available. Lot sales generally benefit when the home market is tight; as buyers are unable to find available waterfront homes, they often choose to purchase a lot and build.
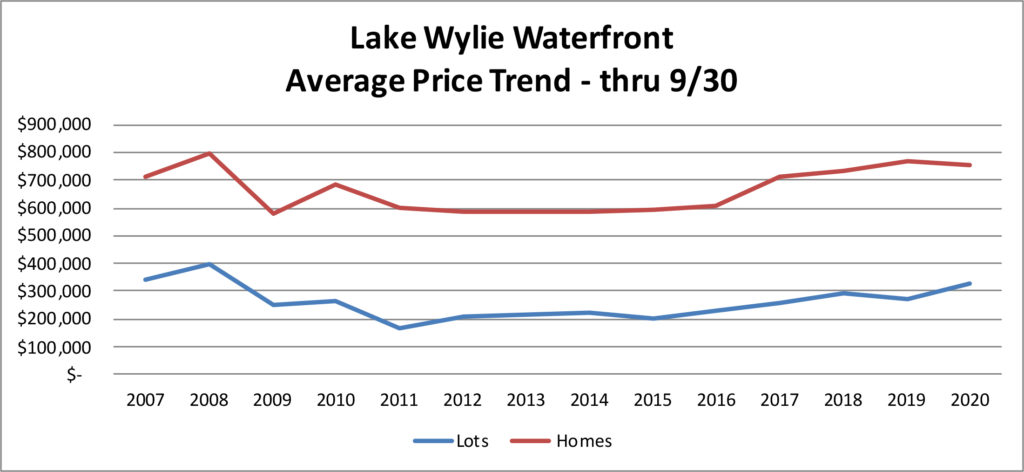
Average prices for waterfront homes and lots have been trending up over recent years:
In the chart above, the blue line represents average waterfront lot price, and the red line represents average waterfront home price on Lake Wylie. So far in 2020, the average price for waterfront homes is almost $760,000, and the average for lots is about $325,000.
We have had some extraordinarily high priced lot sales in The Sanctuary — a 12 acre tract for $1.2 million and three others in the $400’s. Removing The Sanctuary sales, the average lot price is in the mid $280’s — still a strong level in comparison to recent years.
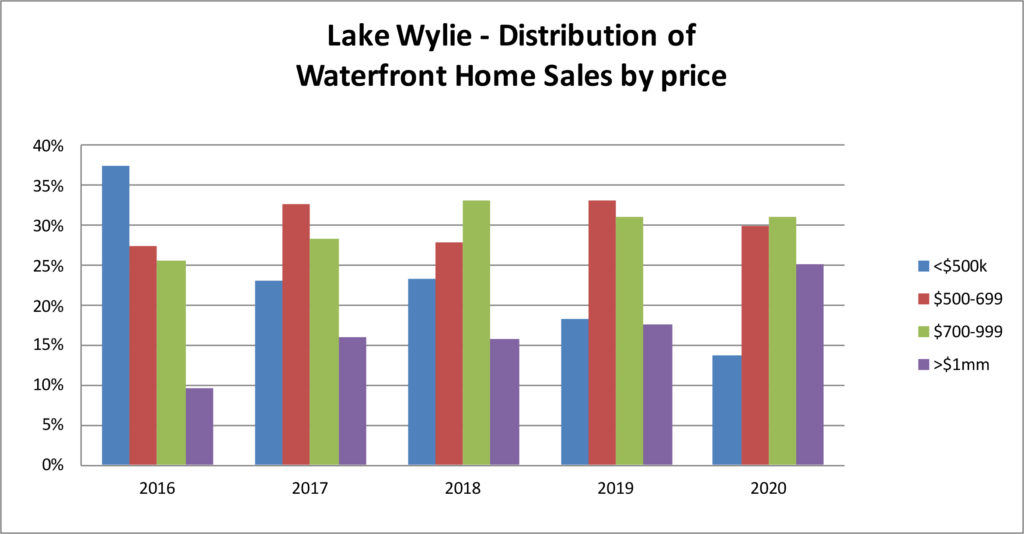
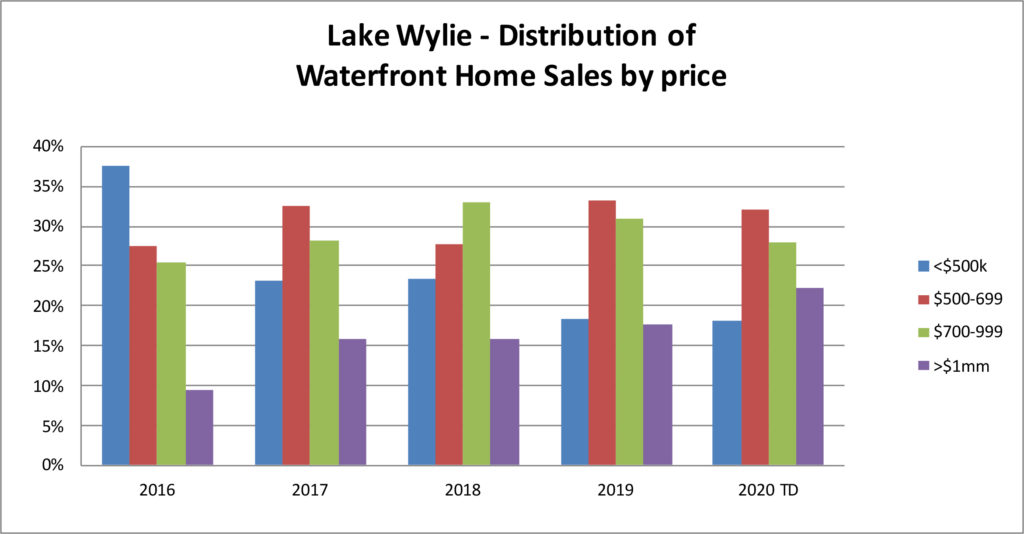
Sales by price segment show increases in the higher price points for waterfront homes:
In the chart above, the blue bar represents the percentage of home sales in the <$500k segment, the red bars represent $500k-$699k, the green bars represent $700k-$999k, and the purple bars represent $1 million+ homes.
Mainly because of lack of inventory in the lower priced segments, the mix of sales has shifted. Also, we have had a larger number of luxury-home buyers in our marketplace, driving an increase in the $1 million+ segment.
Thus far in 2020, 27 homes have closed for $1 million+. In 2019, there were 25 sales in the $1 million+ category at year end, and THAT was a record year! Of the homes currently under contract in 2020, 14 are priced over $1 million, so it appears we’ll see an impressive new record on Lake Wylie.
Typically, the time on market for the luxury priced homes has been quite a bit longer than for the lower priced homes, because the inventory for higher priced homes has generally exceeded demand. With the increase in sales in that segment, inventory is more in line with demand and we’re seeing quicker sales. More than half of the $1 million+ priced homes this year have sold in under a month.
If you’d like to see details on this year’s sales on Lake Wylie, please visit my webpages Recent Waterfront Home Sales and Recent Waterfront Lot Sales.
Is your boat ready for spring weather?
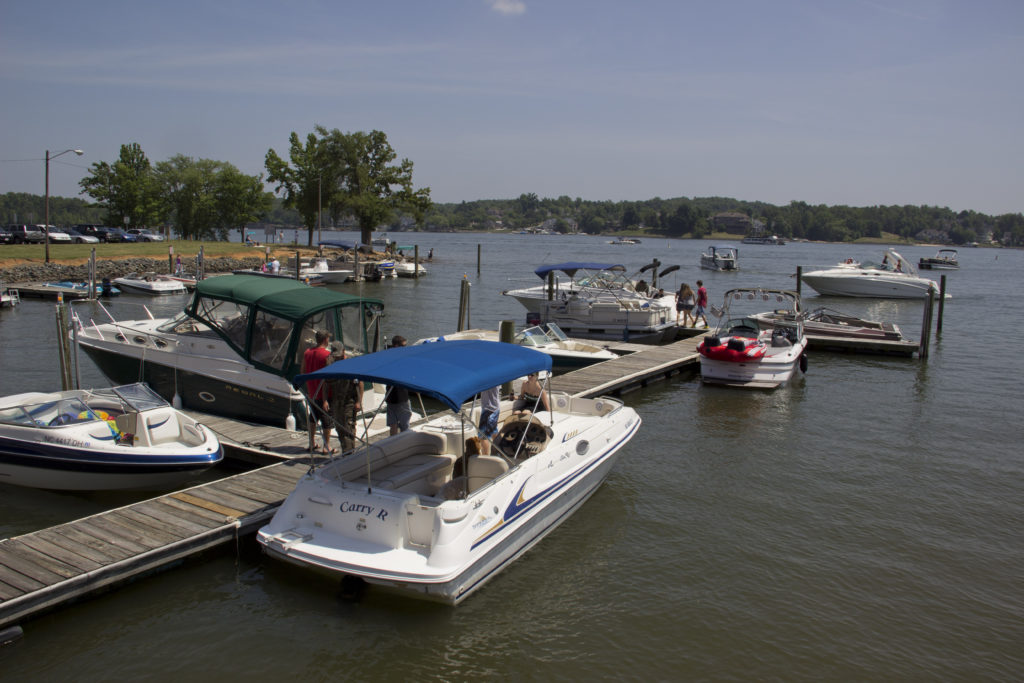
The warm weekend has kicked spring fever into high gear. A few early birds were out on the lake this past weekend, and the deck at TBones on the Lake was hopping with activity as folks got out to enjoy the sunshine.
I remember all too well the summer that my boat was at the mechanic’s from Memorial Day until a few days before Labor Day. It wasn’t pretty. The mechanics get awfully busy during the warm months, and that particular year, they were overwhelmed. So, before you find yourself landlocked, make sure your craft is ready to launch!
Do it yourself, or take ‘er in for a good cleaning and annual maintenance.
Spring Cleaning
– Clean the exterior and put on a good coat of wax.
– Clean the upholstery, polish the metal.
– Make sure all of the compartments are tidy and free of debris.
Engine & Battery
– Check the battery for corrosion, make sure it is fully charged
– For inboard motors, change oil and filters.
– Check transmission fluid & bilge blower.
– For outboards, check & replace spark plugs if needed.
Check lights on boat and trailer. Make sure your boat is fully stocked with anchor, ropes, life jackets, bumpers.
For more tips and resources for enjoying Lake Wylie, visit the best site for Lake Wylie real estate. The Lake Wylie Man is consistently the top selling waterfront realtor in the area, and is your source for all Lake Wylie waterfront homes for sale and events on Lake Wylie.
Waterfront Lots – The Market is Hot!
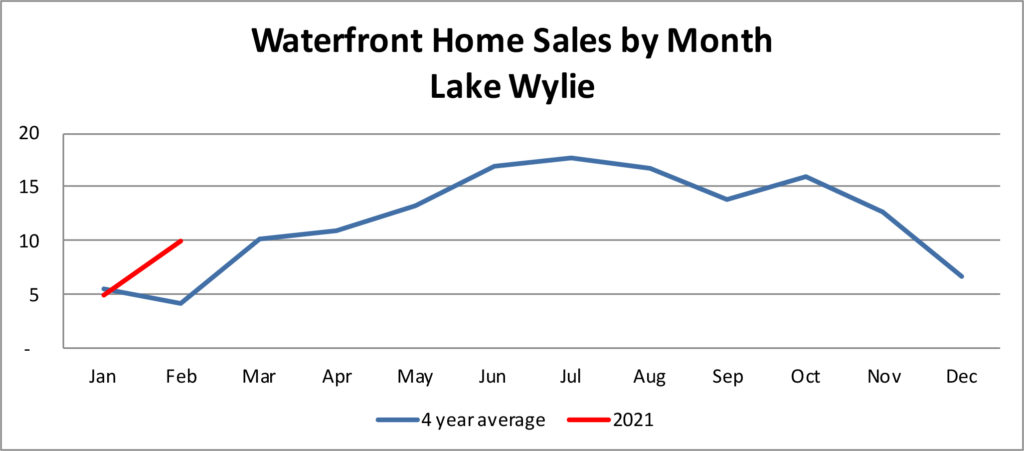
After analyzing monthly waterfront sales for well over a decade now, I know not to put too much importance on what happens in January. Weather, lake levels, and inventory levels are often off-kilter in the winter months, and all of these impact buyer activity. Plus, the winter months are the least active for sales both on and off the water, so first quarter closings don’t always provide a great indication of how the year will turn out.
That being said, with SEVEN waterfront home closings and SIX dockable lot closings in January, the market came out of the gate the strongest it has in several years. In addition, there are currently 24 waterfront homes under contract, and 6 lots, which is impressive given the low inventory levels that plagued us in recent months. Of the homes that are currently under contract, six (25%) were on the market for less than a month.
We have buyers waiting in the wings, ready to purchase, and with record low inventory levels, new listings get a lot of attention quickly. (Pause for a commercial break!) It is particularly important to price your property correctly, prior to listing, and make sure that potential issues are addressed and the property is ready to sell, and having a Realtor experienced in waterfront is vital.
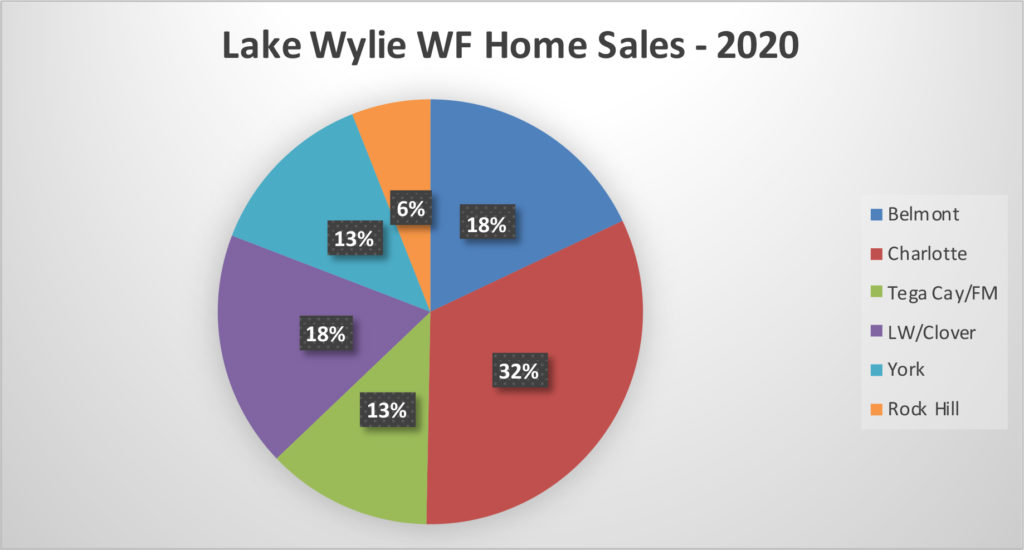
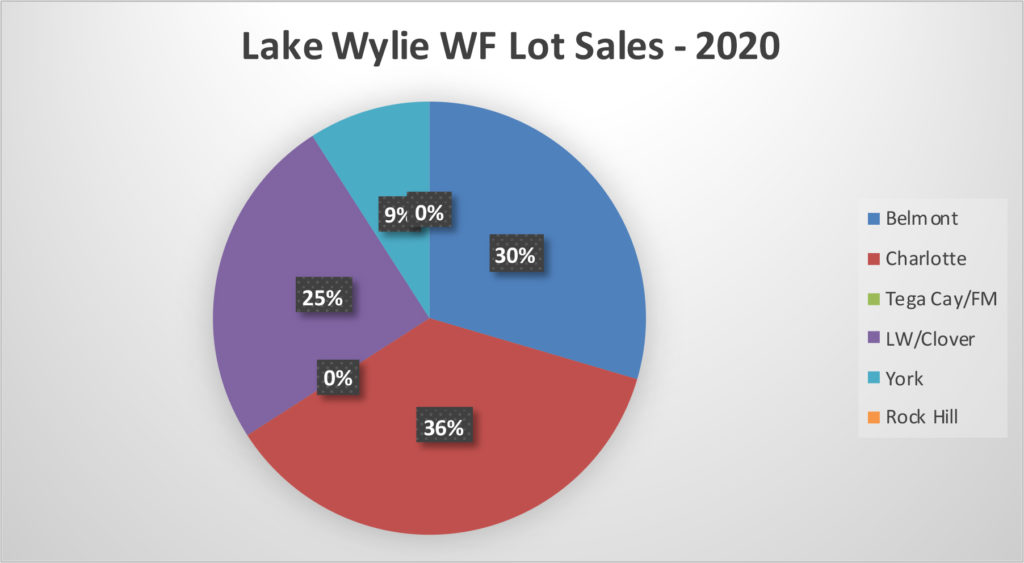
So, what’s selling? Homes under contract are equally disbursed between Belmont, Lake Wylie (Clover School District), and Charlotte, plus a couple of properties in Tega Cay area. The higher priced properties represent the bulk of sales, with 9 over $1 million, and 8 priced $800-$999k. The tightest segments in active inventory are mid-priced and lower priced properties. That tight inventory is limiting sales. There are currently 7 homes under contract that are priced under $800k.
Waterfront lot sales are benefitting from low home inventory, as buyers unable to find ready waterfront homes shift their focus to building. Here’s something interesting: Of the waterfront lots that closed in January, half had been on the market for under five weeks, and two had been on the market for 3-4 YEARS. So average time on market if pretty meaningless! We noted that throughout last year’s lot sales; quite a few lots that had been on the market for years finally sold!
Here’s a closer look at waterfront lot sales since January 2017:
- Belmont, 31 lots, average price $224,000
- Reflection Pointe (in Belmont), 14 lots, average price $154,000
- McLean (in Belmont), 5 lots, average price $432,000
- Lake Wylie (Clover School Distr.), 24 lots, average price $280,000
- Charlotte, 17 lots, average price $317,000
- Rock Hill, 3 lots, average $287,000
- Tega Cay/Fort Mill, 3 lots, average $370,000
Reflection Pointe in Belmont still has a number of dockable waterfront lots selling for less than $150,000. This development was hardest hit by the recession, and slowest to recover. Meanwhile, just down the road in McLean, lots are commanding premium prices. Woodland Bay and choice main channel lots are also yielding prices over $300,000.
In Lake Wylie, properties go up in price as the location gets closer to the Buster Boyd Bridge. Handsmill on Lake Wylie is also beginning to sell well. There have been lots on the southern end of the lake, around Allison Creek, selling above $300,000, but similar lots in the 29710 zip code generally sell for 10-15% higher.
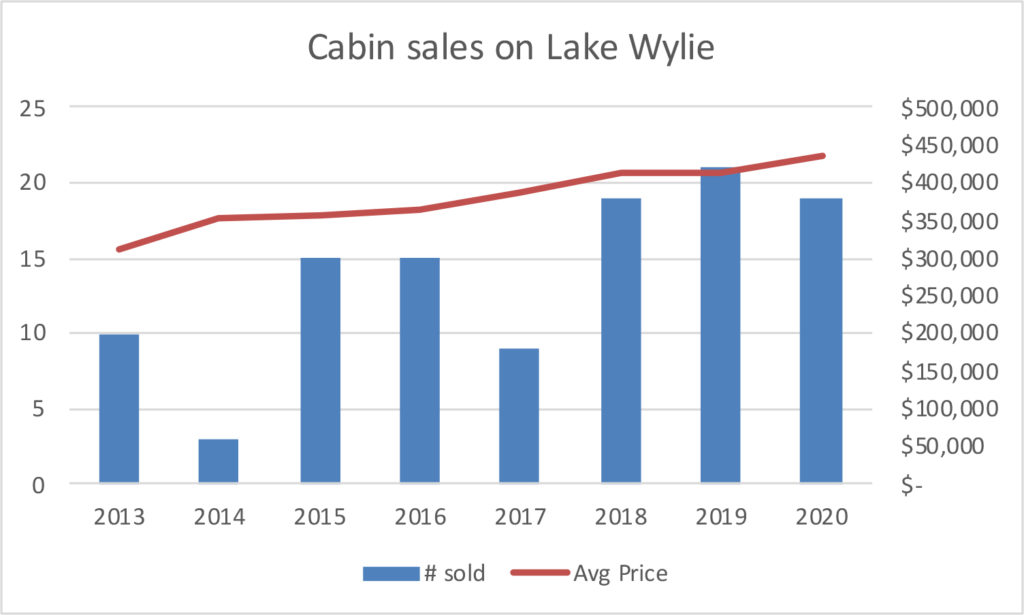
Good news for sellers of waterfront cabins! Average sale prices have been on the rise for the past few years. Take a look:
Waterfront cabin sales on Lake Wylie, Average Price by Year
2013 – $311,000
2014 – $355,000
2015 – $355,000
2016 – $364,000
2017 – $386,000
The price for waterfront cabins is impacted by the buyer’s planned use for the property. If they plan to remove the cabin and build a permanent home, the presence of the cabin can be seen as a negative. But often a buyer wants to enjoy the cabin as it is, prior to building or as a second home indefinitely. Cabins that are neat and in good condition command a premium price.
If you’d like to see more data on recent sales, visit The Lake Wylie Man Waterfront Market Sales Report for 2017. The Lake Wylie Man is the leader in waterfront sales on Lake Wylie. Rely on the market expert for buying or selling waterfront real estate!
Waterfront Sales Update – Year End 2017
In a time where the market is bullish, the number of Lake Wylie waterfront home sales in 2017 actually dropped 12% vs. 2016. Consider this: NON-waterfront home sales rose 6% in York County, 19% in Belmont, and 17% in the southern Charlotte (zip code 28278) area, in comparison to prior year sales.
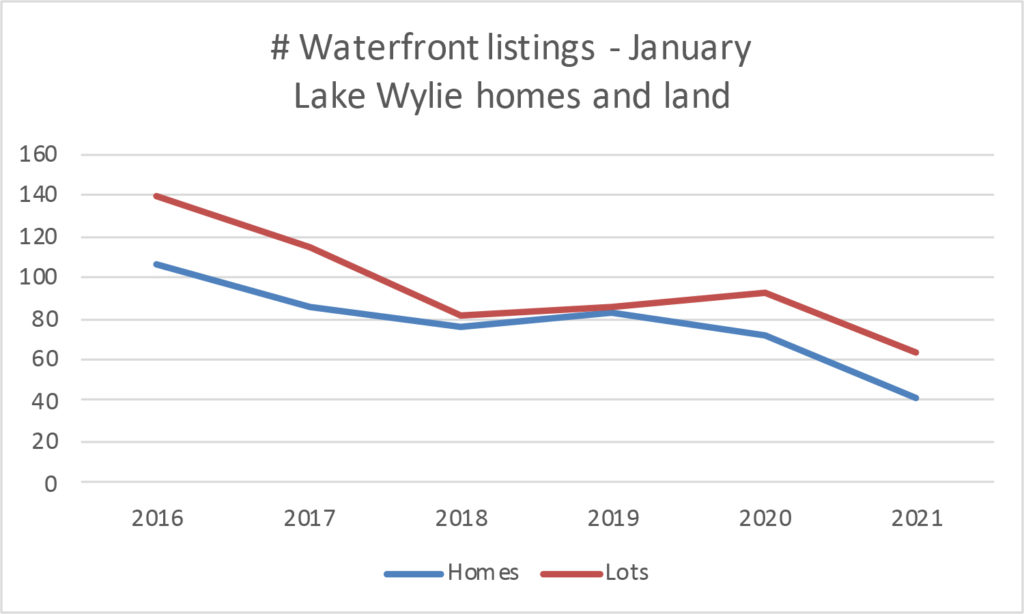
Of course, we know the culprit for the lackluster waterfront performance: LACK OF INVENTORY FOR SALE. Number of waterfront homes for sale have been steadily declining over the past few years, but in 2017, we dropped to record lows. Demand far exceeds supply, especially in the lower and mid-price categories.
As a result, we’re seeing classic economic consequences. Prices are edging up, particularly in those low-to-mid priced properties. Time on the market is shorter, which many properties being snatched up in the first few weeks on the market, and at full (or close to it) asking price. Waterfront lot sales are at a record high, with many buyers turning to building their own home, instead of waiting for one to come on the market that meets their criteria. Overall, it is a great time to be a seller, indeed!
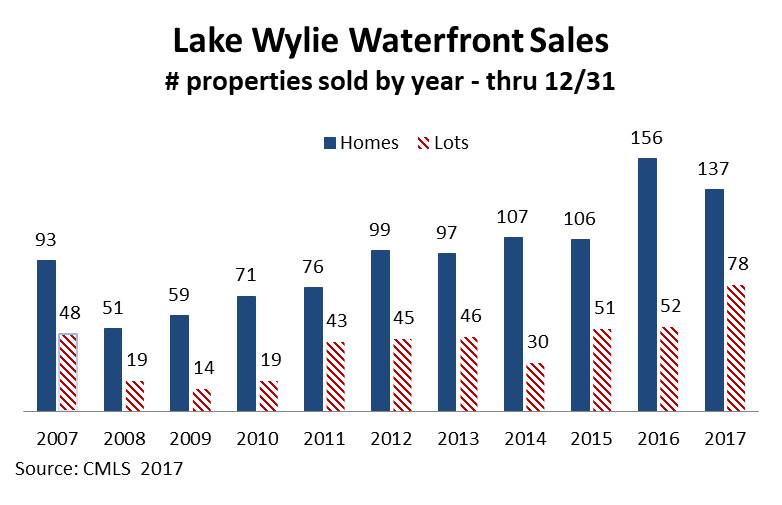
Let’s take a look at some of the year’s highlights:
In the chart above, the blue solid bar represents number of waterfront homes sold by year, and the red striped bars are number of waterfront lots. In 2017, number of homes sold dropped by 19 (12%), and number of lots sold increased by 26 (50%) vs. prior year. Waterfront lot sales are at RECORD LEVELS this year.
Even though we’re showing decreases in home sales in comparison to last year, however, sales are up significantly in comparison to sales since the market “recovery” beginning in 2012, and well above the sales level before the recession. We’ve been lucky this year with the weather, without a drought affecting the lake levels.
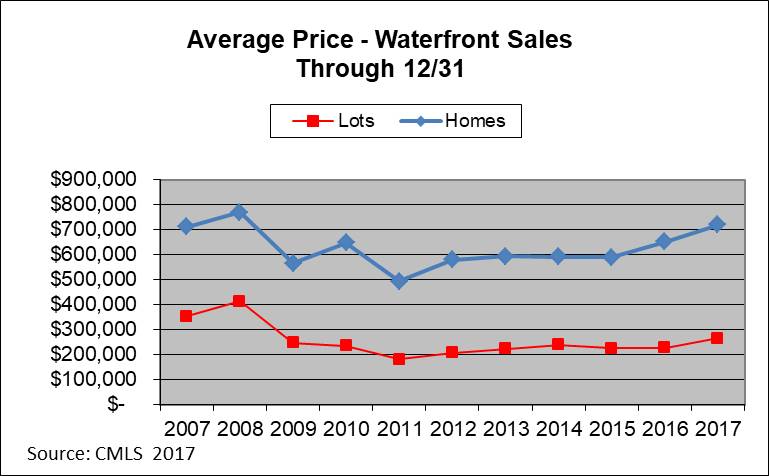
Average sales prices are up for both waterfront lots and homes:
In the chart above, average sales prices for waterfront homes are shown on the blue line, and waterfront lot prices are shown on the red line. In 2017, the average WF home sale was $720k, the highest price achieved since 2008. In comparison to last year, the average home price increased 10% and the average lot sales price increased 17%. Does that mean you can immediately post a price increase on your property? Not necessarily.
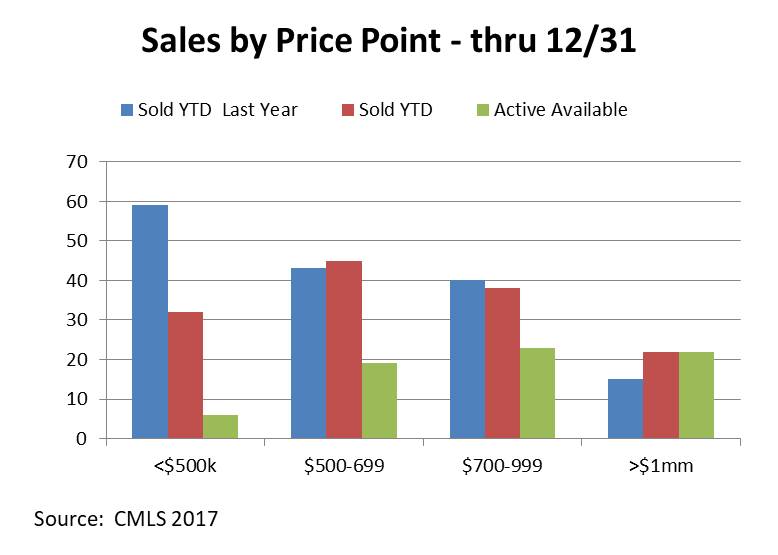
Most of the price increases were due to a shift in the mix of properties sold. In 2017, the market had a record number of sales of $1mm+ homes (a total of 22!). At the same time, the lower priced home sales were way off due to inventory shortages. See chart below:
In the chart above, the blue bar represents 2016 waterfront home sales, the red represents number of homes sold in 2017, and the green represents current listings (as of the first week of January 2018).
Sales in the lowest price segment were down by almost HALF, and this is the category responsible for the downturn in total waterfront home sales in 2017. There are currently just six waterfront homes listed for under $500k, which makes a huge impact considering that this has traditionally been one of the strongest segments. (In some years, the $500-$699k segment has been first.) In this lowest priced segment, most of the homes are older (average age is 40), and smaller (average square footage is just under 1900 square feet.) Older homes in Tega Cay, cabins/weekender homes, and modest styled homes around the lake comprise this segment. Due to the shortage in inventory, sales have occurred quickly, with 44% of sales in this segment occurring within the first month of listing. Sellers in this category can be a little more aggressive with their pricing, asking 10-15% more than they would have a couple of years ago, depending on condition and location.
Inventory is also fairly tight in the $500-$699 segment, usually the top or second top selling category on the lake. 2017 sales were up by two houses over 2016. Homes in this segment averaged 30 years in age, about 3175 square feet in size. Average prices in this segment were very consistent with the previous year, and average time on market was about four months. About 42% of sales in this segment were on the market for less than a month. If homes are move-in ready and offer a strong location on the lake, sellers can expect a modest price improvement (5%) over recent years.
Homes in the $700-$999k price segment averaged about 19 years old, 4200 square feet. The Clover school district and south Charlotte area are by far the leaders in this home category. These homes do take a little longer to sell, with time on market averaging about 5 months, with 29% on the market for less than a month. Inventory levels (homes for sale) have held steady over the past few years, and are at the most favorable levels relative to sales. Supply is sufficient for demand. New listings are needed to replace homes that are sold, of course, but this segment is in the best shape, balanced between sellers and buyers. Therefore, sellers need to be pay particular attention to condition of home, marketing and staging, curb appeal, and competitive pricing to make sure buyers choose their homes over others.
Homes over $1mm have shown the most dramatic increase in sales, with 22 sales (compared to a record setting 15 last year, and 8 in 2015.) Historically, this segment has had inventory exceeding sales, sometimes with up to a 5 year “supply.” With the record setting sales this year and last, some of that inventory has worked its way through the system. While there is still an “oversupply” of listings relative to sales, the picture is much more positive for sellers than in recent years. Average time on market for homes sold $1mm plus was about 6.5 months this year, with 18% of the sales having time on market of less than a month. Home sales in this segment were pretty evenly spread between the Clover school district, Fort Mill/Tega Cay, Charlotte and Belmont. Average age of homes sold in this category was about 15 years in 2017, with about 5650 square feet. New construction, particularly in McLean, played a role in improving the price for this category. Established homes, however, need to be competitively priced and offer a “Wow!” factor in order to gain attention above the competition: Extraordinary location/views, outdoor features such as pools/outside kitchens/fireplaces, gourmet kitchens, and excellent move-in ready conditions.
With properties moving so quickly, especially in the low-and-mid-priced segments, sellers should expect buyer interest “right out of the gate.” If there is no strong interest within the first couple of months, sellers should be prepared to make adjustments on price or make improvements, according to showing feedback.
Waterfront Lots sold at RECORD LEVELS in 2017. Here is the breakdown by price:
Under $200k – 22 lots – most in Belmont. Down from 28 sales in 2016.
$200-$299k – 25 lots – most in Clover school district and Charlotte. Up from 15 sales in 2017.
$300-$400k – 22 sales , up from just 7 in 2016. A few “premium” lots in Belmont, plus Charlotte and Clover school district.
Over $400 – 9 sales, up from 4 sales in 2016. A few in McLean, , a couple in The Sanctuary, premium sales in Tega Cay, The Palisades
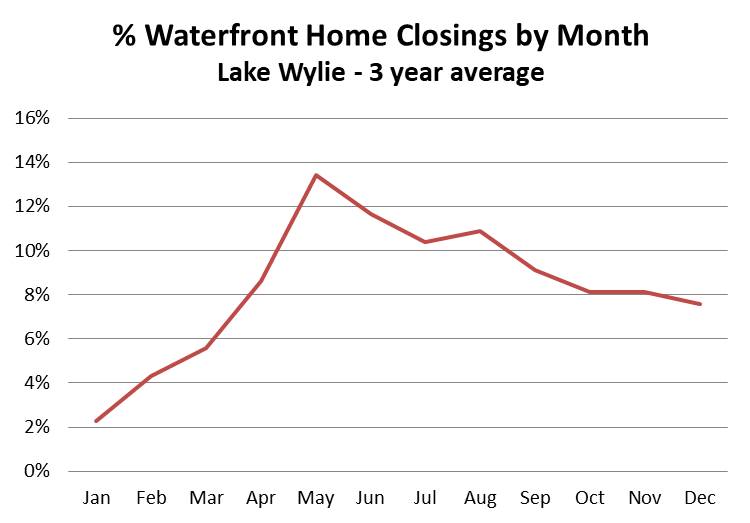
If you’re considering selling your home in 2018, when should you put it on the market? Below is an average for the last three years, closings by month. Keep in mind that most homes “close” about 6 weeks – 2 months after a contract is written, so if the closings peak in May, then most likely those homes went under contract in March.
January and February historically have the lowest number of closings each year (November/December sales.) March/April picks up considerably, and closings peak in May through August. NOW IS THE TIME to start getting ready to list your home. Talk to the experts (that would be The Lake Wylie Man, of course) for the most knowledgable advice in pricing and marketing. Once again, The Lake Wylie Man outsold all other realtors on Lake Wylie – – with THREE TIMES the number of sales in comparison to the next highest selling waterfront realtor in the market. For the past decade, The Lake Wylie Man has led the market by a huge margin. That’s not luck – – that’s experience, marketing, and solid customer service.
For details about recent waterfront sales, please visit my webpage: Recent Lake Wylie Home Sales or Recent Lake Wylie Lot Sales. I look forward to talking with you about YOUR property.

