Happy New Year, everyone! I hope you all enjoyed the holidays and wish you all the best in the coming year.
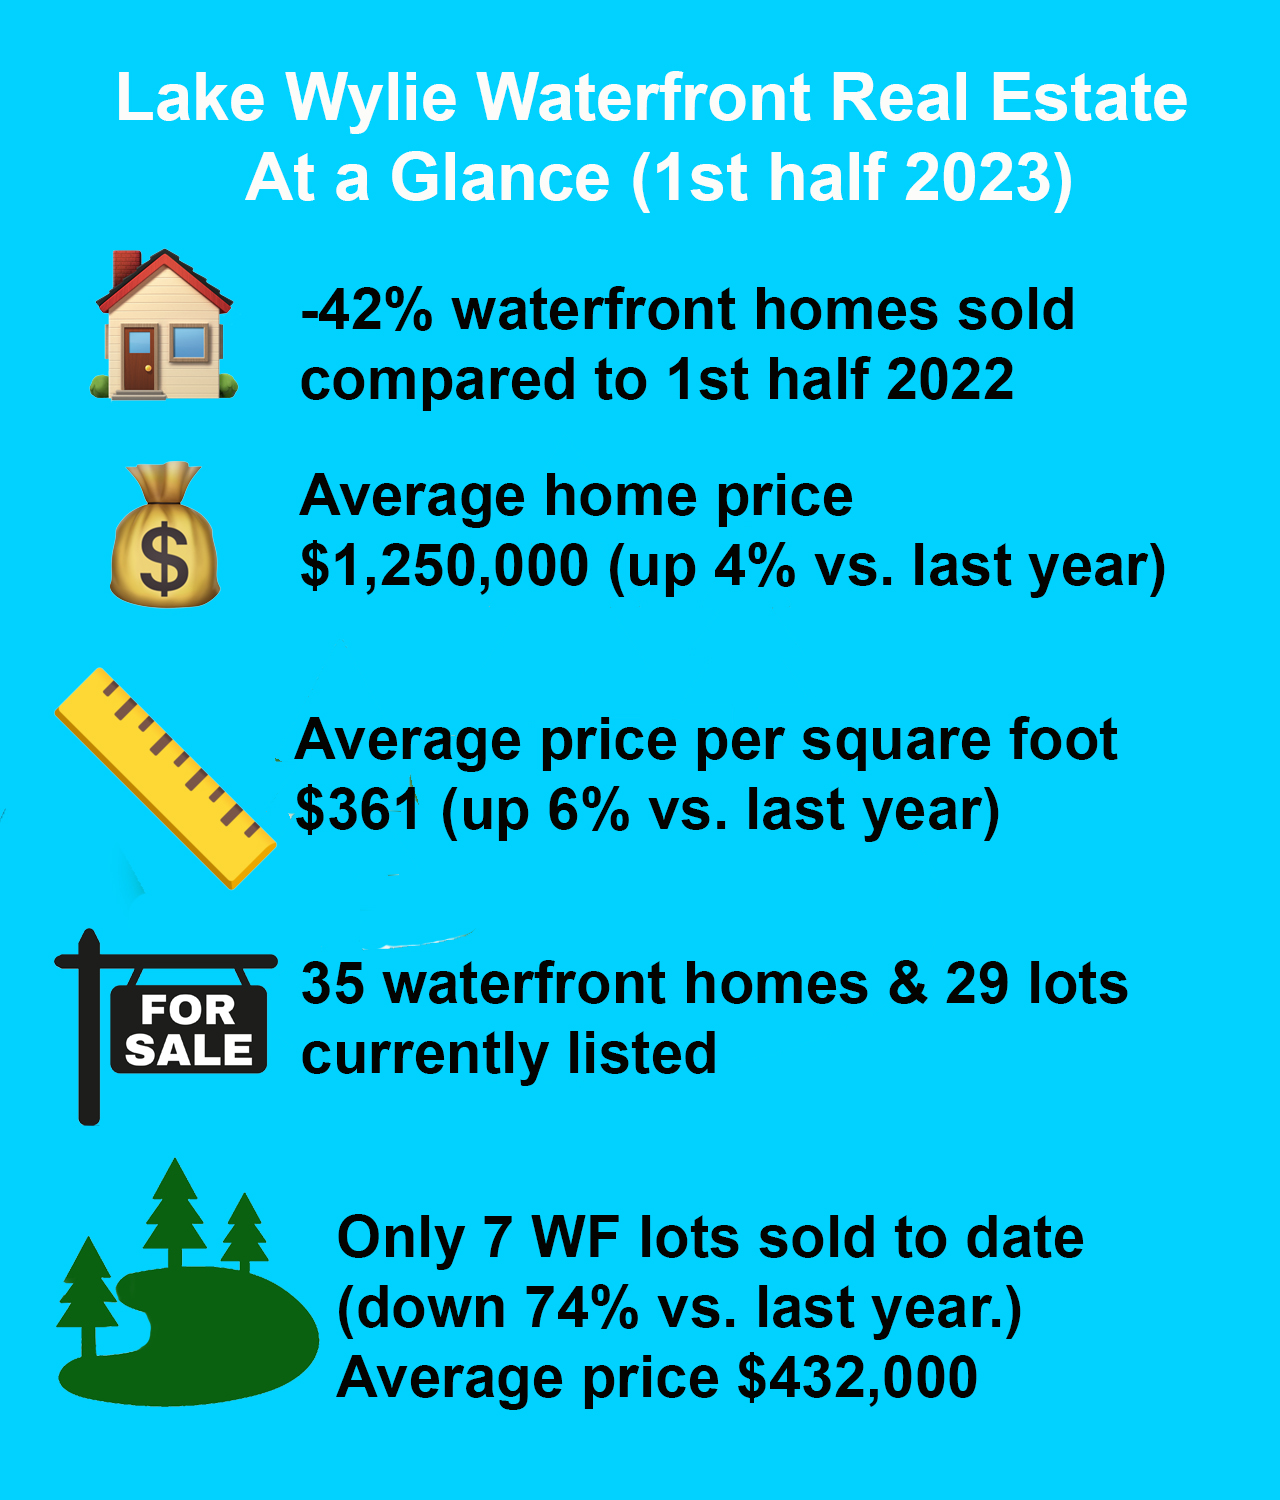
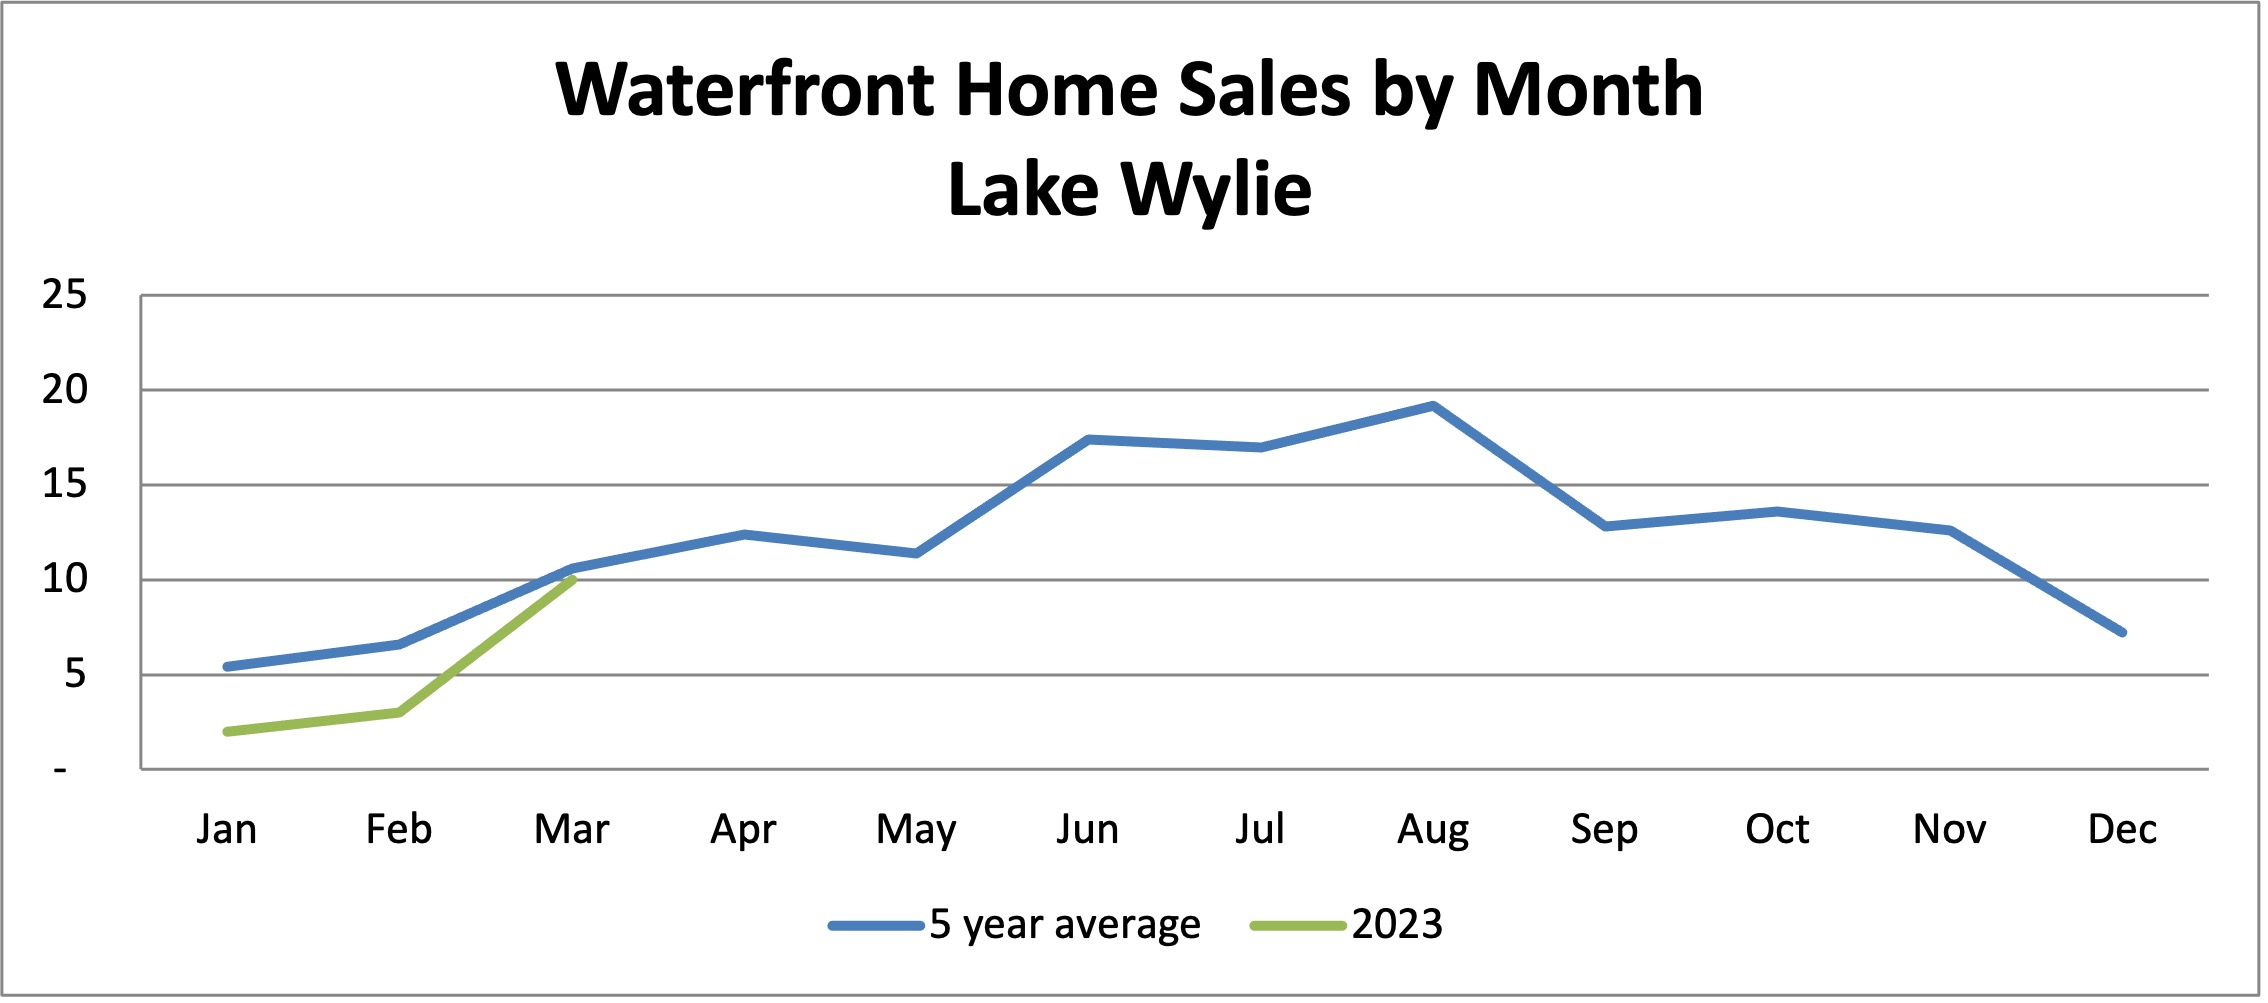
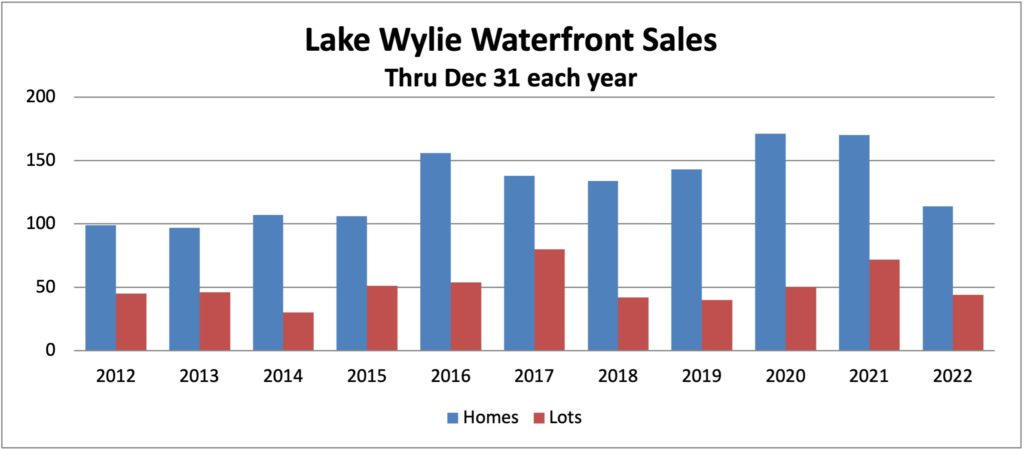
Real estate sales on Lake Wylie ended 2022 in a bit of a fizzle, with just three waterfront homes and two waterfront lots closing in December. It didn’t come as a surprise, as sales and available inventory have been on the decline since early in the year. However, in spite of the number of home closings being down 33% from 2021, dollar sales were down just 13% — because the homes that DID sell were at average prices 30% ABOVE last year.
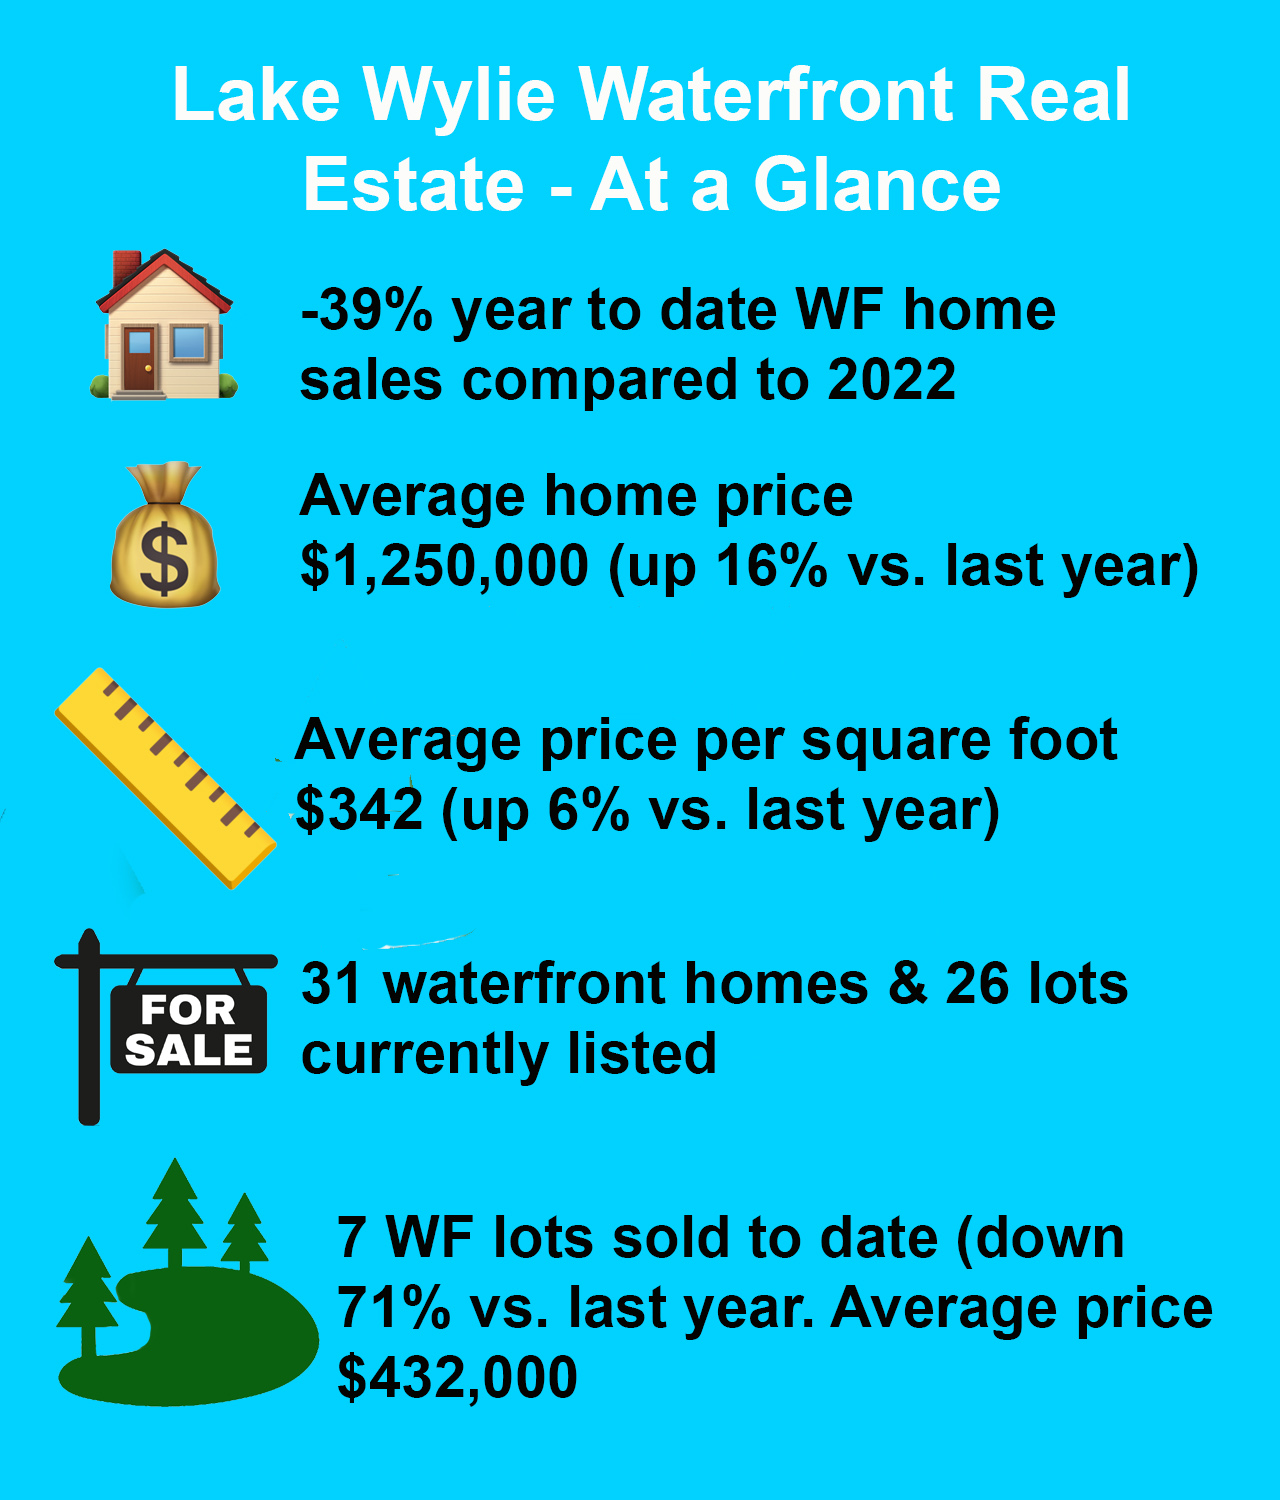
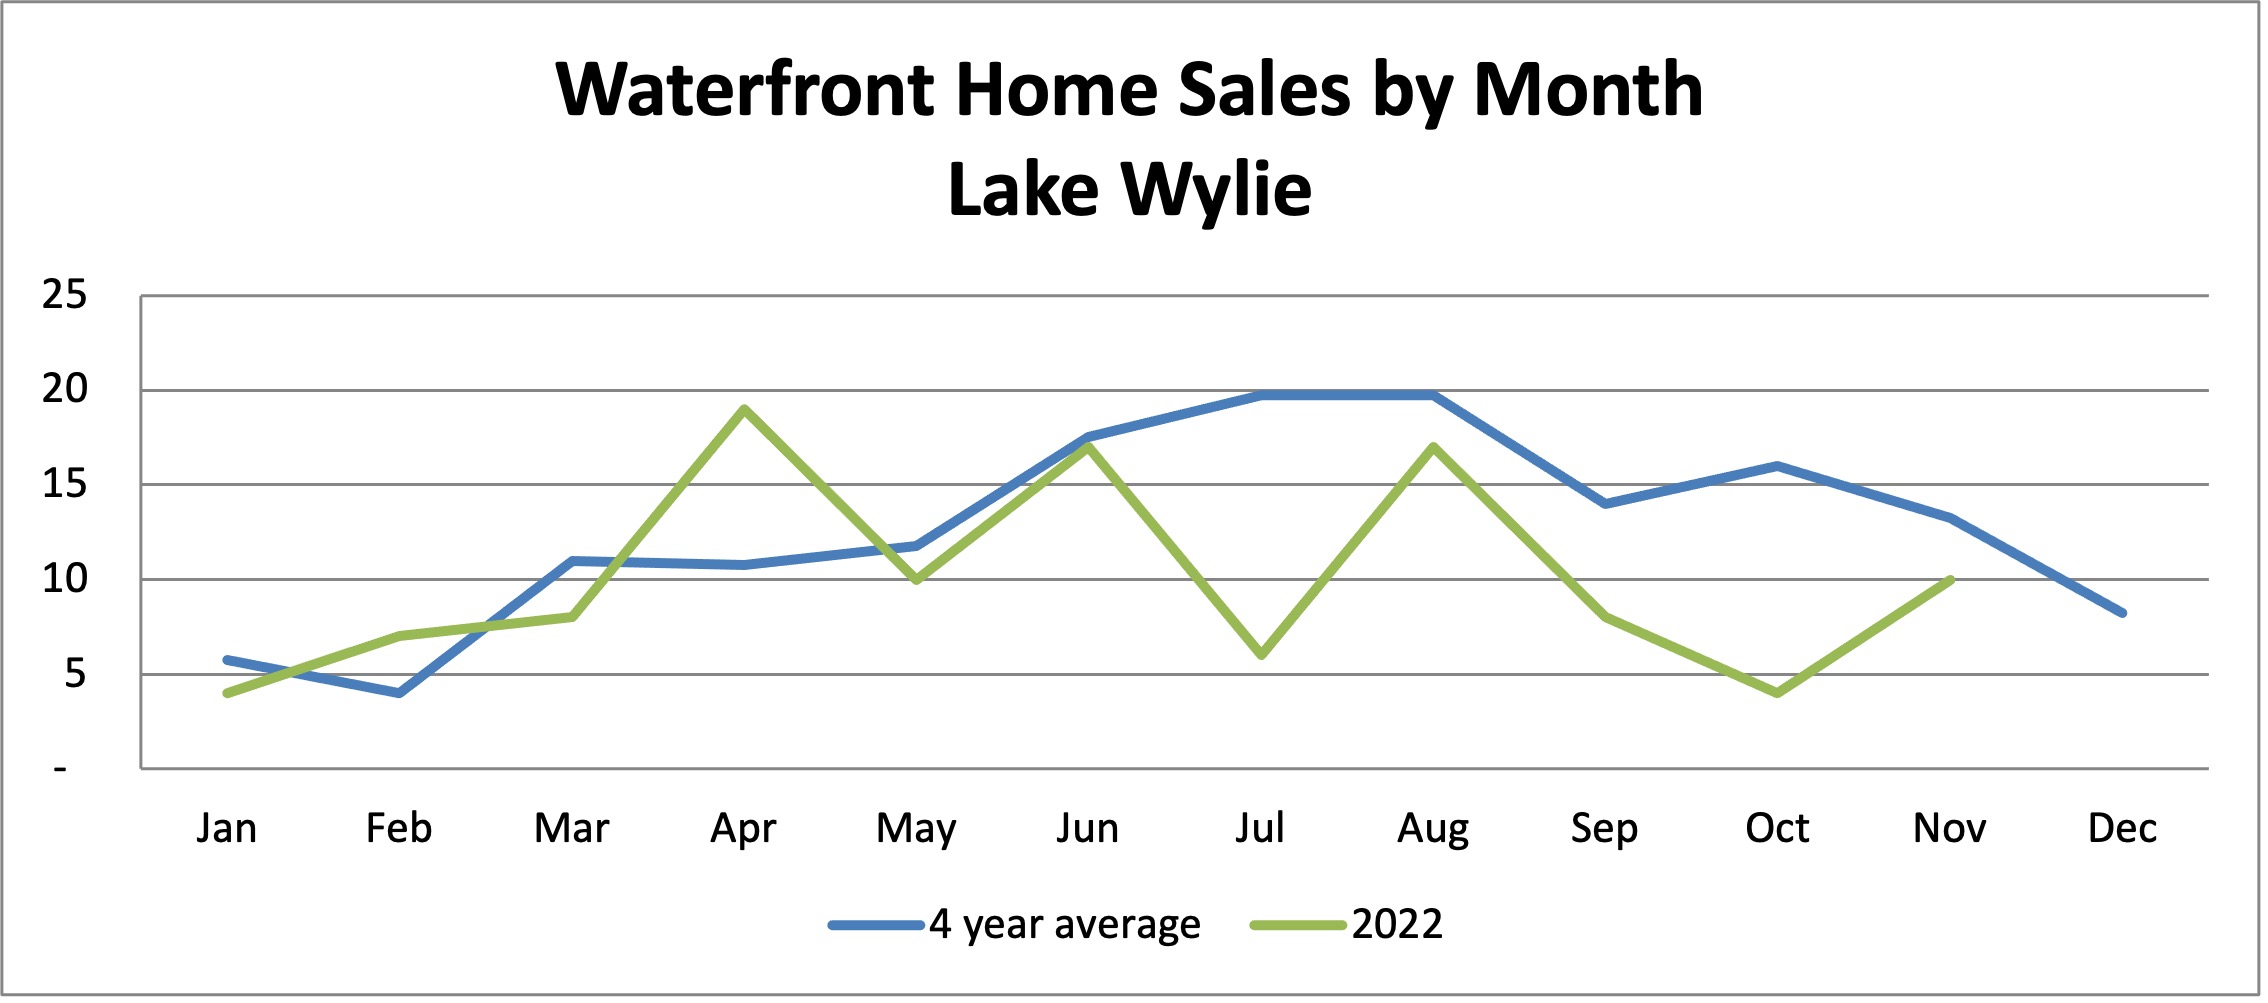
Take a look at the remarkable trends of 2022:
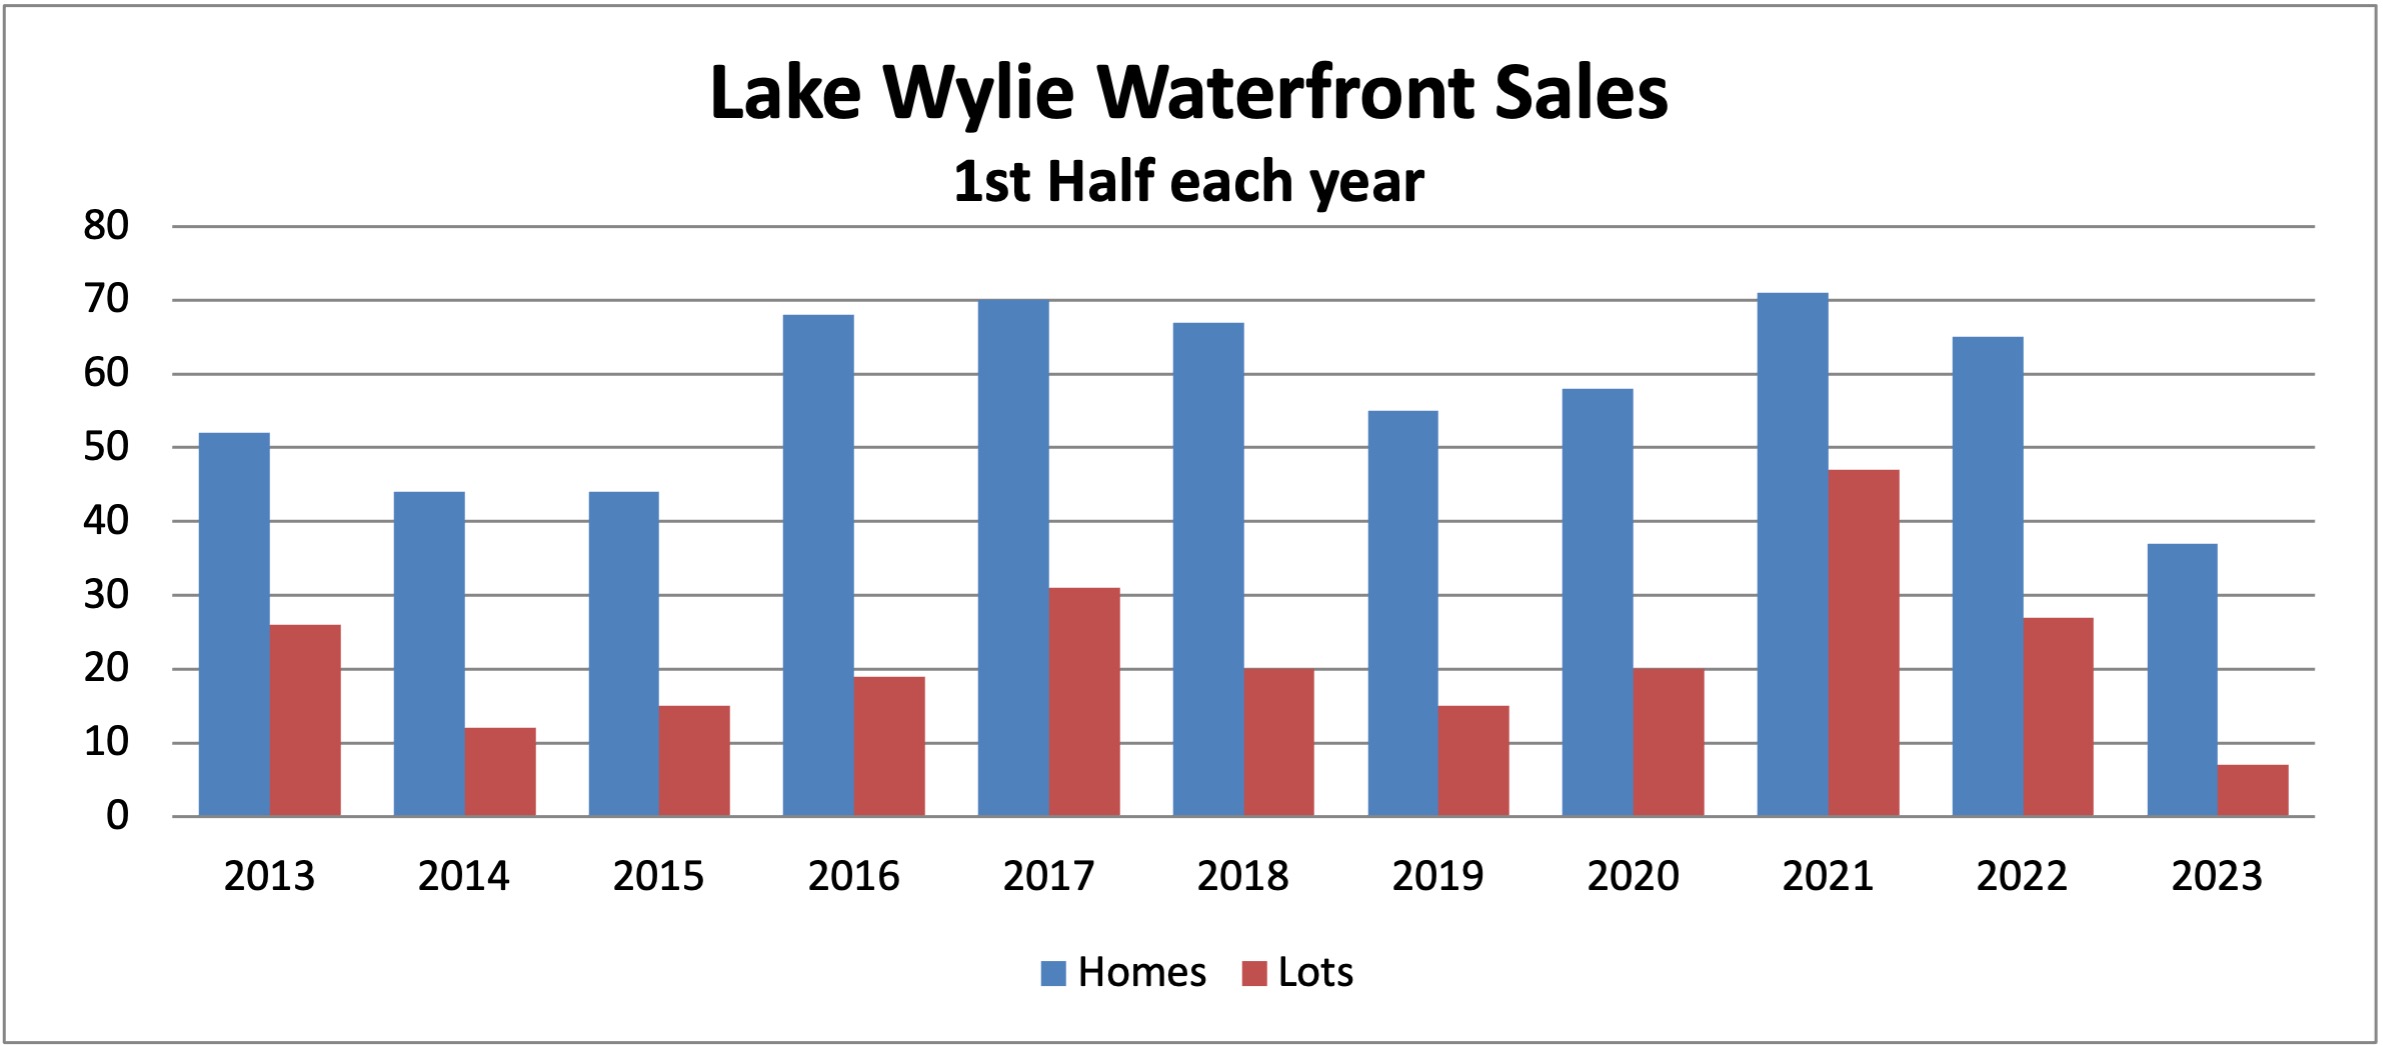
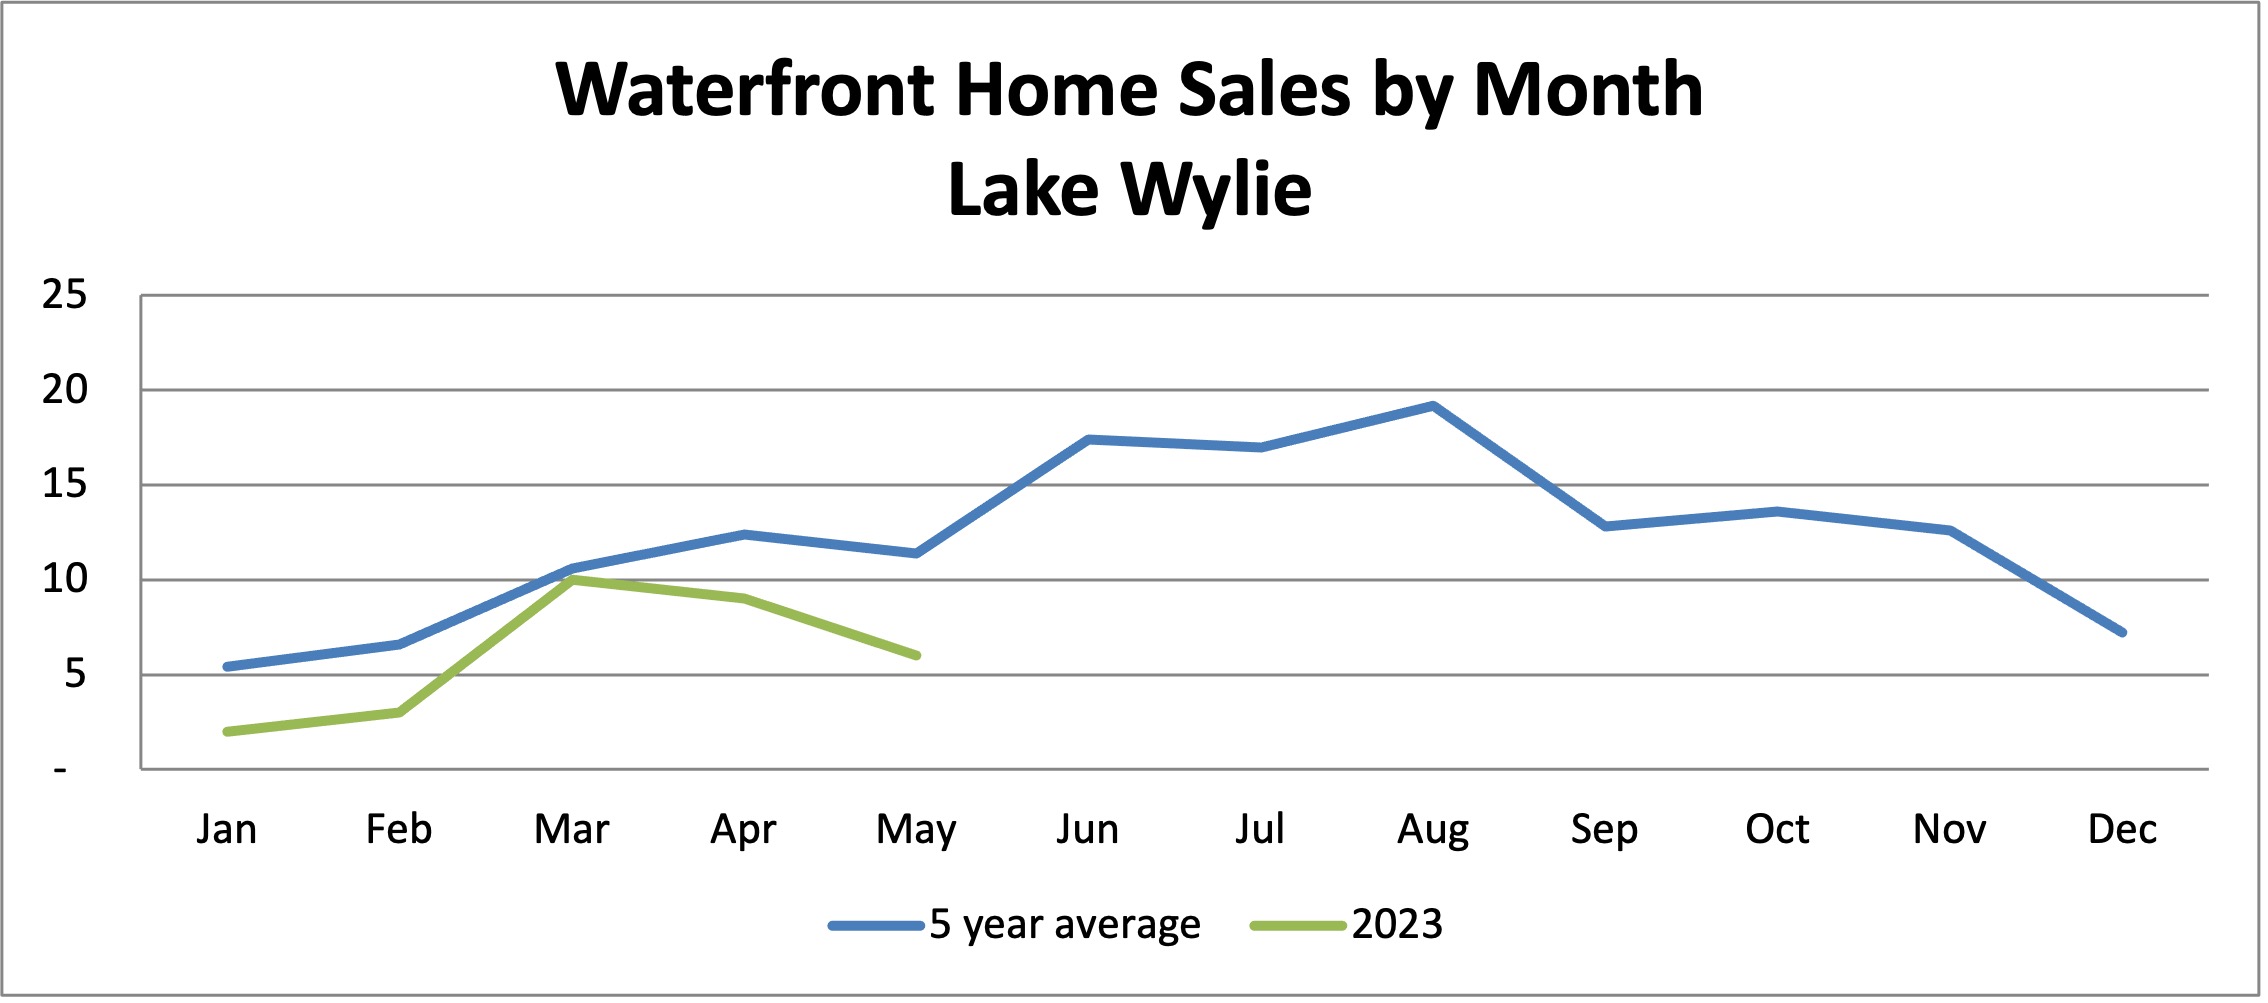
In the chart above, the blue lines represent the number of waterfront homes closed on Lake Wylie each year, and the red lines represent dockable lots. After four years of home sales on the rise from 2018 – 2021, 2022 sales fell 33% from the previous year. Lot sales, which tend to fluctuate more from year to year, were also down in 2022.
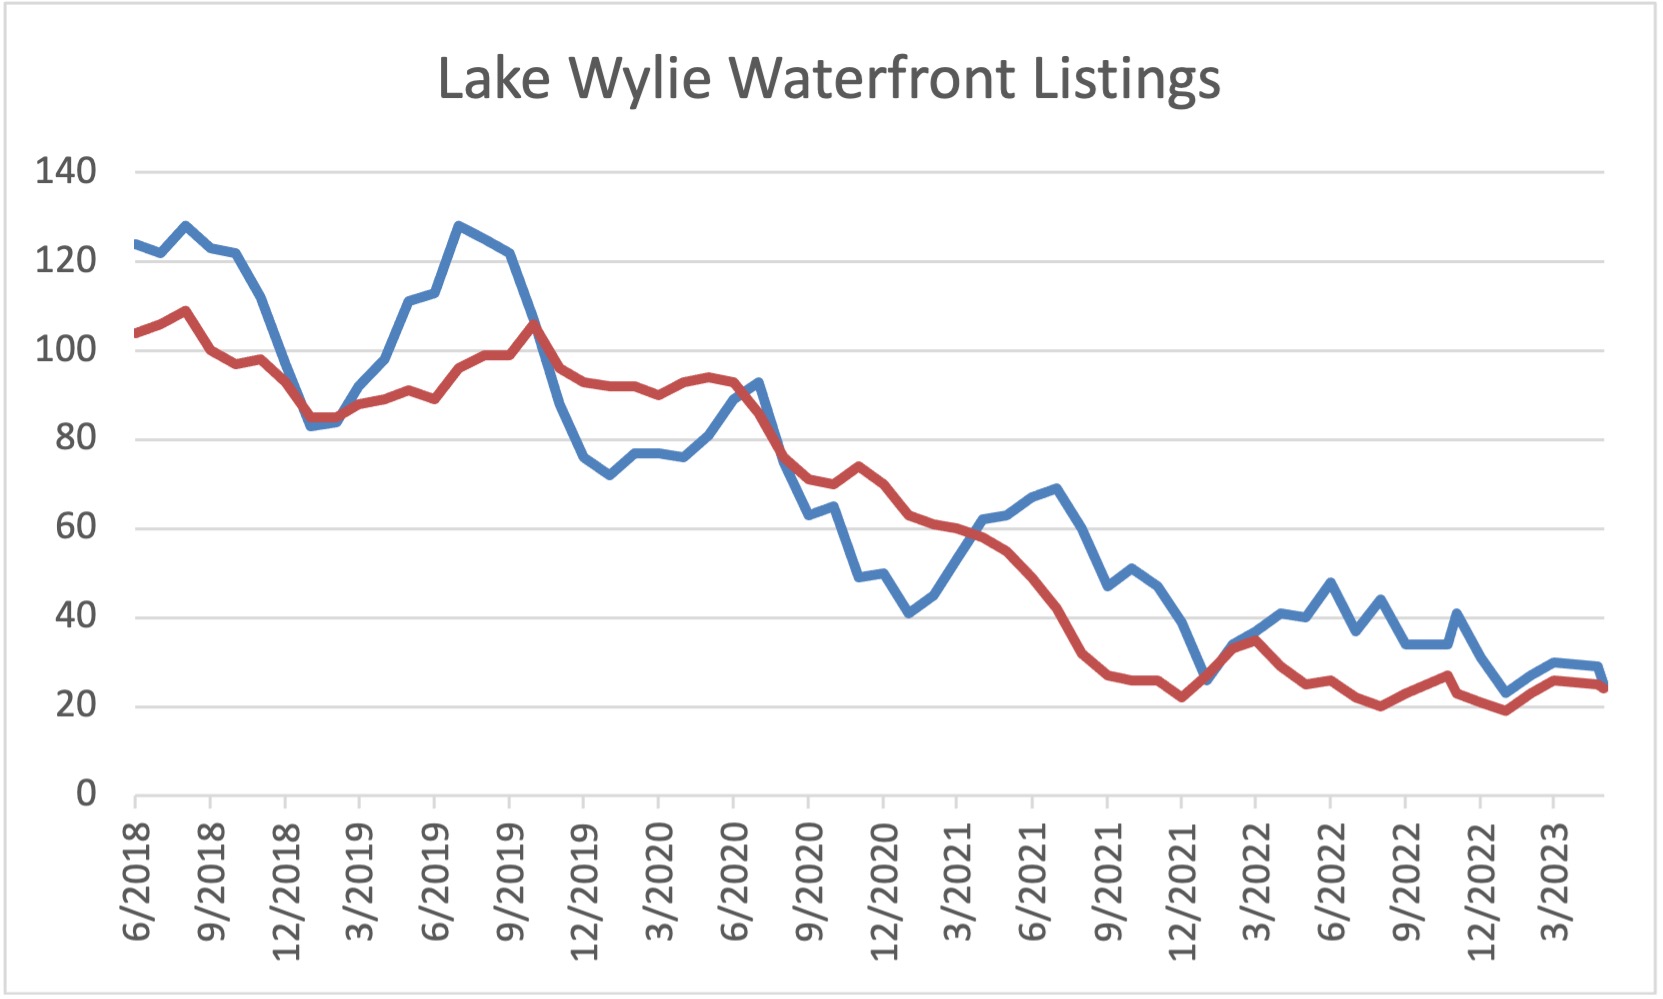
Limited inventory was the primary culprit for the decline in sales.
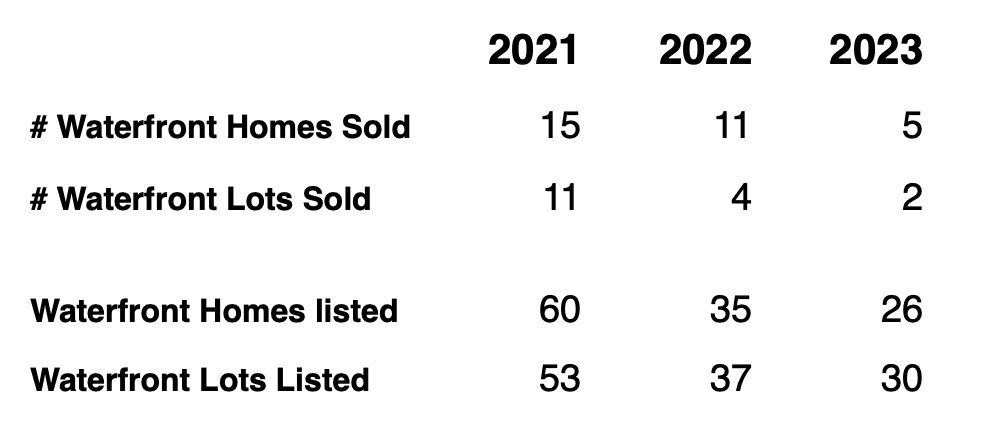
In 2022, the average number of waterfront homes listed over the 12-month period was just 36, compared to 100 homes available on average in 2019, before the pandemic. There were only 25 lots listed in the average month in 2022, compared to 93 in 2019.
Demand far exceeded supply. Prior to the pandemic, the average waterfront home sold had been on the market about 4 months prior to going under contract. This past year, the average was about one month. Many homes went under contract within the first week, often at or above full asking price, with multiple offers commonplace
While the trend of multiple offers has slowed, sellers still have the opportunity to realize significant gains when selling their correctly priced homes — pent-up demand is still high and inventory is extremely low.
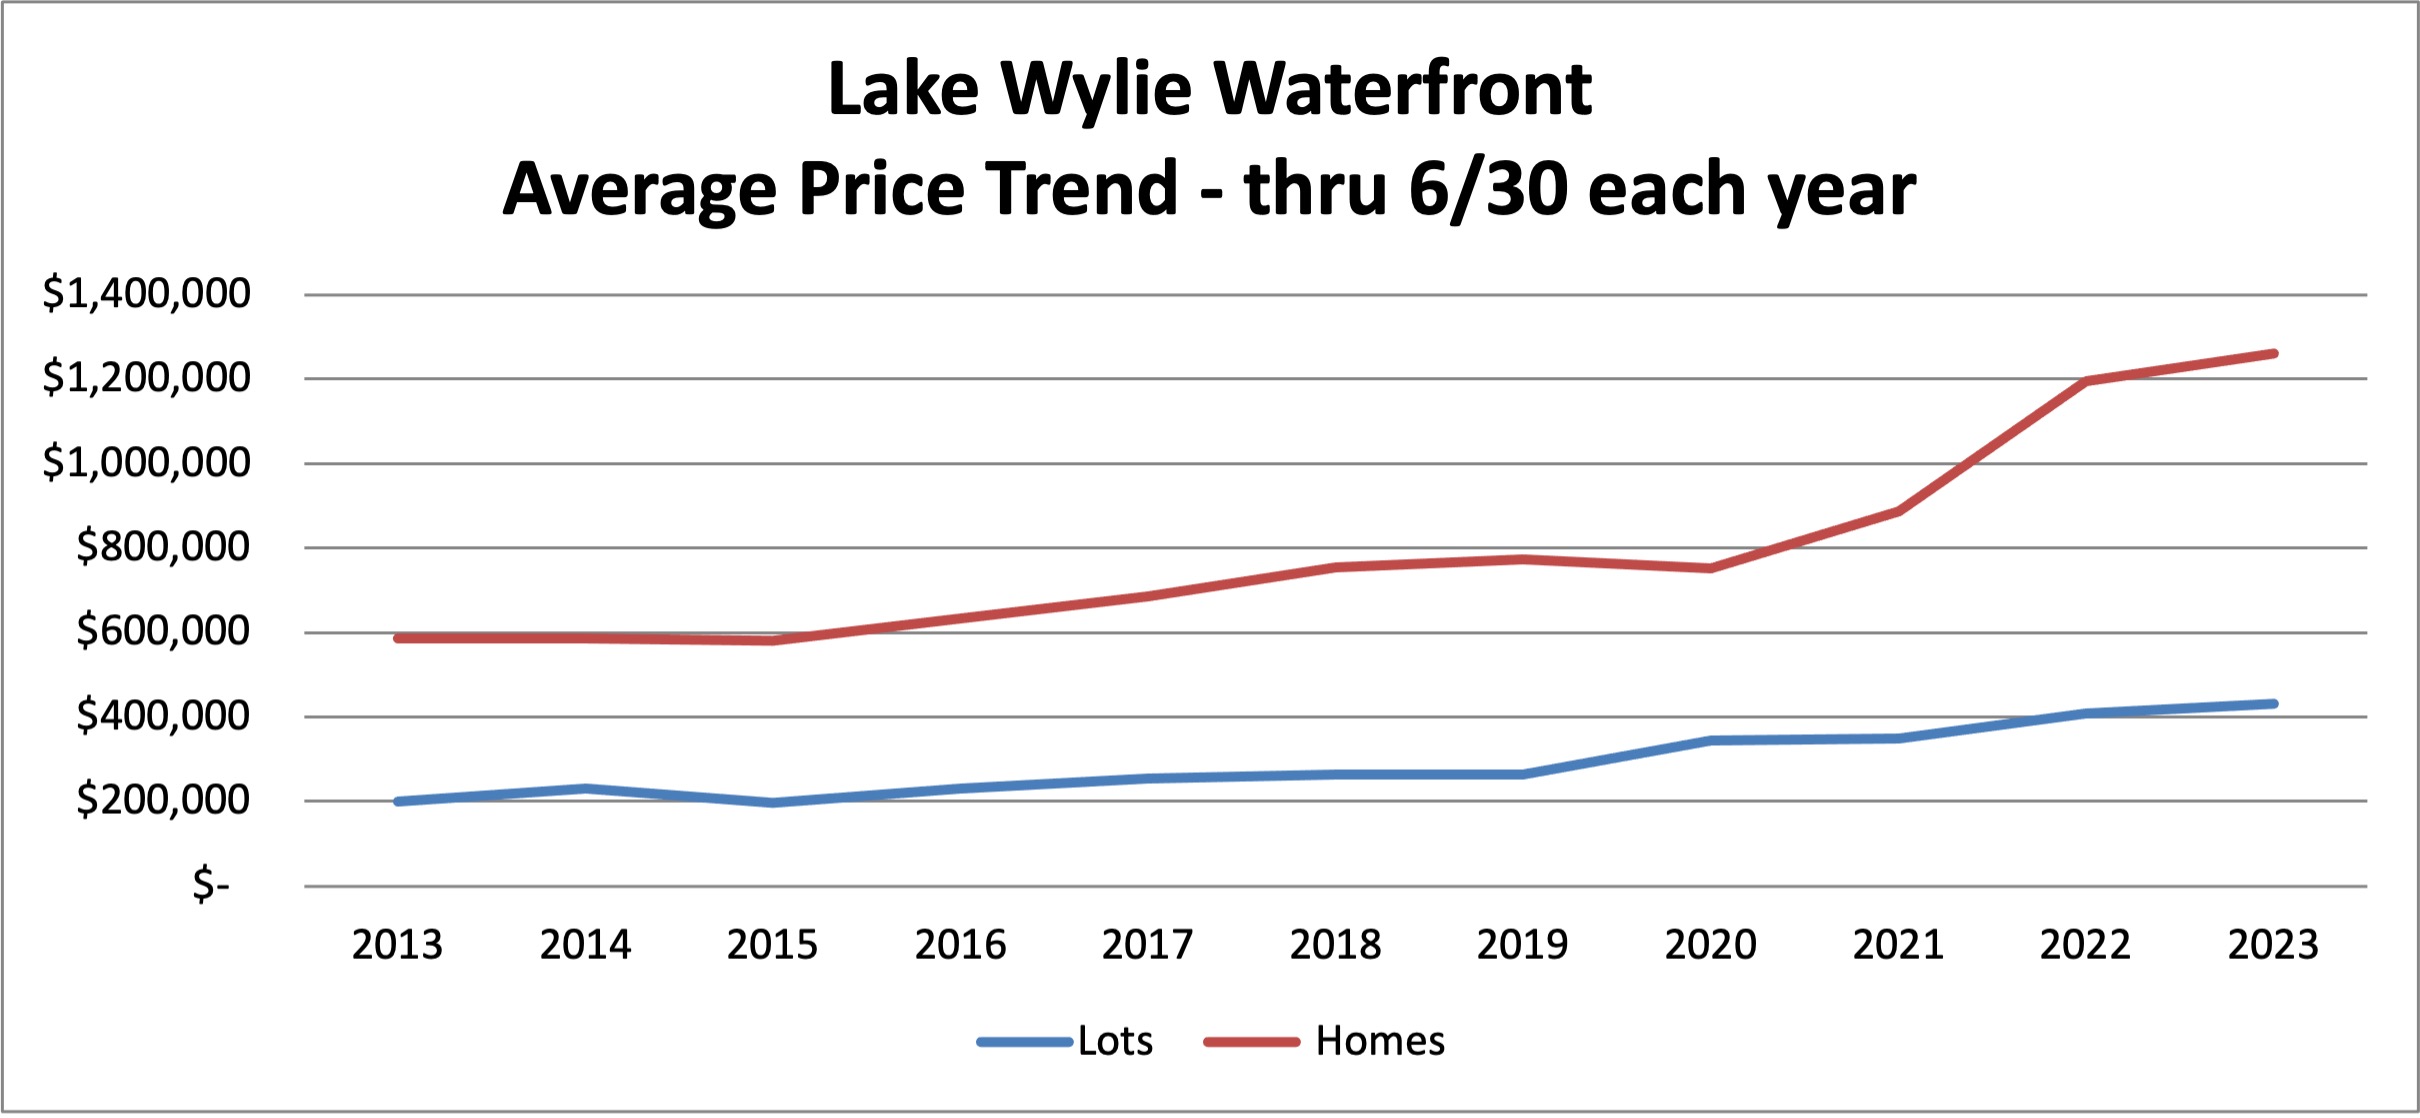
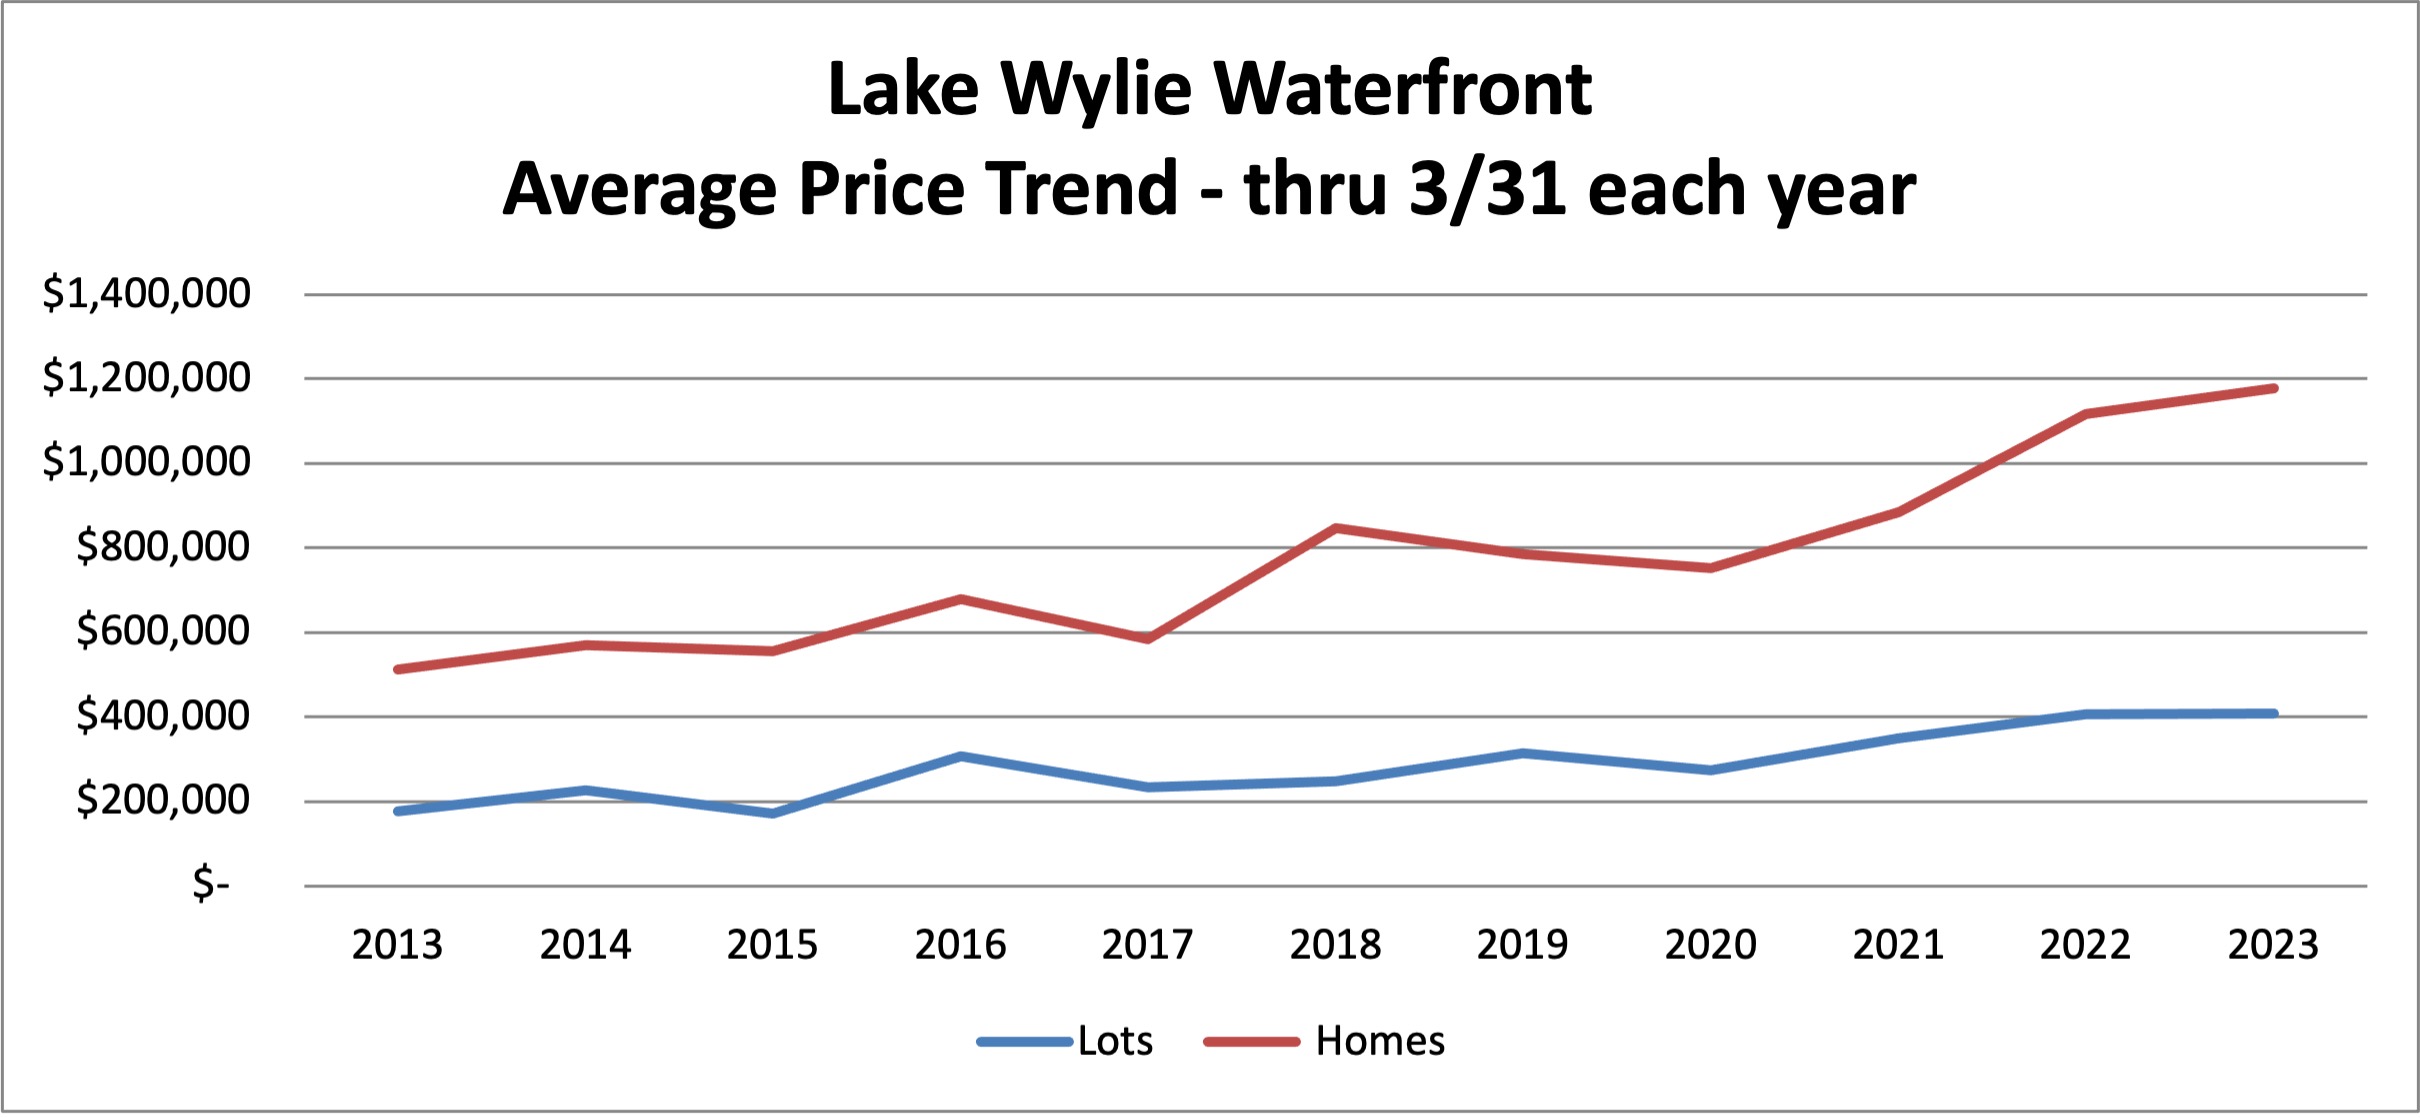
Average prices on the lake continue to climb:
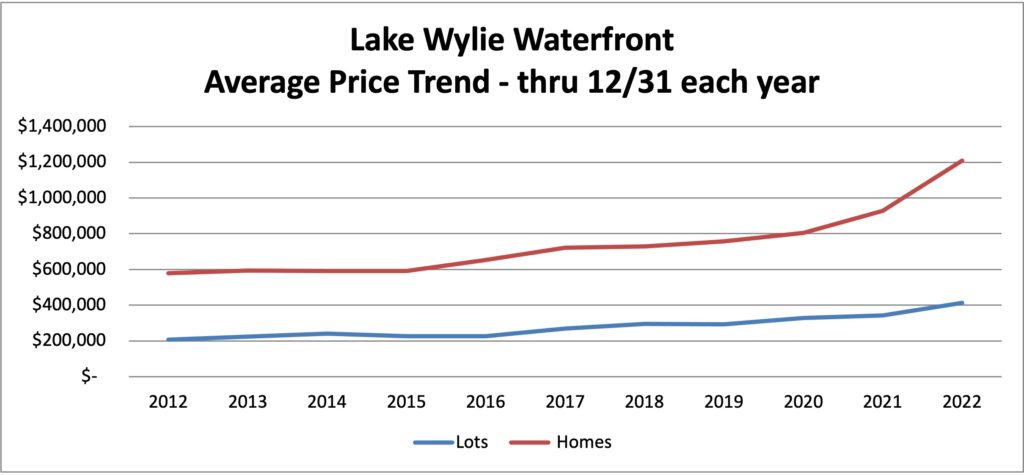
The red line represents the average waterfront home price on Lake Wylie, and the blue line represents lot prices. In 2022, the average closing price for homes was $1.2 million, up almost $300,000 from last year.
Part of the reason is available listings: the tightening inventory is most pronounced in the low-to-moderate priced homes. In addition, home prices have skyrocketed.
We have to be careful when comparing price per square foot for one waterfront home vs. another, as many factors affect price: the lot type (main channel vs. cove), water depth and quality, location on the lake, surrounding properties, size and quality of dock and other outdoor features — in addition to the traditional size, age and style of home, level of finish, number of bedrooms, kitchen and bath features, etc.
Looking at general trends, however, it can be helpful to evaluate rising prices relative to average square footage. In 2022, the average price per square foot for waterfront homes on Lake Wylie was $340 — about double that of a home not on the water. The price per square foot rose 20% over 2021 homes— partially due to a shift towards more luxury priced homes, and partially due to a shift in prices due to a shortage of supply and increase in demand, and general inflation.
Compared to pre-pandemic, the price per square foot for Lake Wylie waterfront is up just over 60%.
The next chart shows the dramatic shift in home sales by price point:
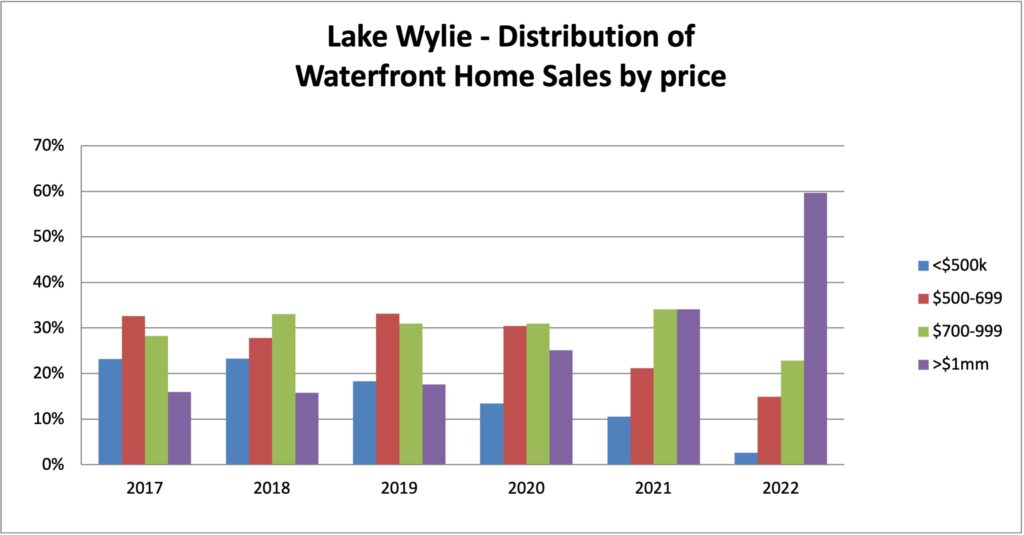
Above, each set of bars represents the breakout of sales by price point, according to the percentage of sales falling into segments: under $500k (blue), $500-$699k (red), $700-$999k (green) and over $1 million (purple). Just five years ago, the majority of sales were in the moderately priced $500-$699k segment, with the $1 million+ falling well behind other price points. This year, the bulk of sales (60%) were homes priced over $1 million.
Five years ago, some of these million-dollar homes would have been priced in the $600’s and $700’s. Rising prices have pushed those homes into what once was a “luxury” priced segment. Another factor, though, is a more pronounced shortage in listings in more moderately priced homes.
Entry level pricing on the lake has risen to over half a million dollars, but many buyers do not understand what those dollars will buy. A waterfront home priced around $600k will be an average of 40 years old, with about 2,000 square feet. The average waterfront home priced in the mid $800’s will be about the same age, with 2,600 square feet.
For $1.5 million, the buyer can expect a 20 year old home with about 4,400 square feet — a nice view and larger dock, gourmet kitchen and some outdoor living spaces.
Cabin sales on Lake Wylie
As the lake area becomes more developed, the “river cabins” of the past have evolved. Years ago, most of the properties on Lake Wylie were used only on the weekends, and were very simple in nature — a bedroom or two, no central air-conditioning, built of cinder-blocks or wood. These properties were often on premium lots, main channel or wide open views. As the lake real estate shifted to accommodate full-time residents, some of these cabins remained, and many have been updated and remodeled over the years.
Buyers purchase these properties to use as “weekenders” — or remove the original cabin to build a permanent home on the premium lots. Cabin prices have been on the rise for the past couple of years:
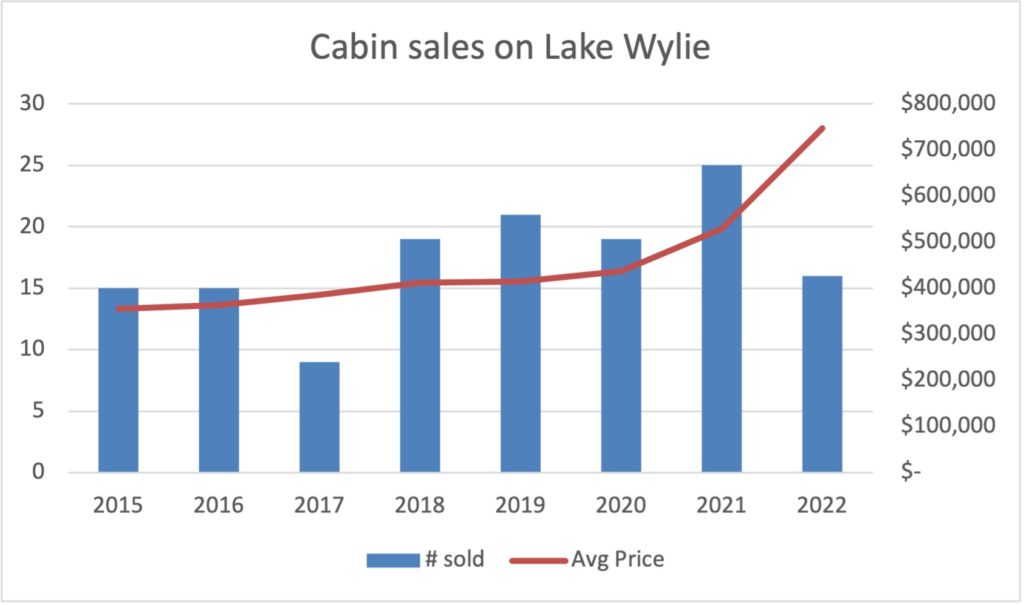
In the chart above, the blue bar represents the NUMBER of “cabin” properties sold, and the red line represents the price. In 2022, 16 cabins sold with an average price of about $750,000 — up significantly from the low $400’s price pre-pandemic.
“Cabins” are generally small (this year’s average size was 1400 square feet), with 2 bedrooms. Most had been extensively updated.
Other Lake Wylie Trends:
- New construction on the lake is on the rise. Seven newly built homes closed in 2022, and there are an additional seven under contract. (Note: these numbers are homes listed on the MLS – – the numbers are much higher when considering private sales and homes built for those who purchase lots and build.) New construction has only recently bounced back from recession days.
- Tega Cay is hot! The average home price in 2022 was $1.1 million — but the average size of home sold was just under 2,000 square feet, yielding the highest price per square foot on the lake. Some of the original homes in Tega Cay have been extensively updated and remodeled, and the location is highly desirable among buyers.
- The highest average priced homes sold in the York area of Lake Wylie ($1.4 million), followed by Charlotte ($1.3 million). Rock Hill had the lowest average priced waterfront home (just under $800k).
- Most of the waterfront lot sales are still in Belmont, the most underdeveloped area of the lake. Most of the lots sold in Belmont were in McLean developments, priced at a premium.
If you have any questions about Lake Wylie real estate, or would like to talk about your property, please give me a call. Once again, for each year during past decade and a half, The Lake Wylie Man team has led the market on Lake Wylie, outselling every other Realtor on waterfront properties. You can count on our expertise to navigate the special considerations regarding waterfront properties and lead you to the best outcome.